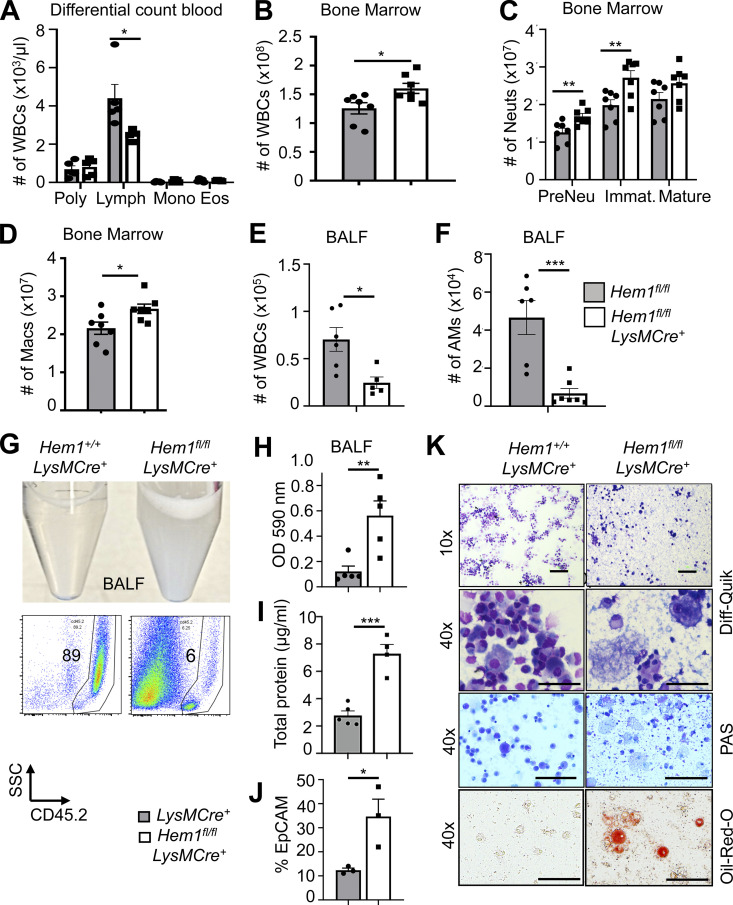
Figure 2.
Myeloid-specific disruption of Hem1 results in lymphopenia, increased myelopoiesis, and decreased AMs, resulting in PAP. Bar graphs of data derived from Hem1fl/flLysMCre+ and Hem1fl/fl control mice. (A) Complete blood and differential counts. Poly, neutrophils. (B) Total WBC number in BM. (C) Total neutrophil (Neut) number in BM. Immat., immature. (D) Total macrophage (Macs) number in BM (gated as in Fig. 1, E and F). (E) Total WBC number in BALF. (F) Total number of AMs (singlet gated, CD45.2+CD11c+SiglecF+CD11bintCD64+) in BALF. (G) Representative photograph of BALF (top) and flow histogram of BALF showing CD45.2 percentages and SSCloCD45.2− debris (bottom). (H–J) Bar graphs depicting BALF turbidity assessed by OD at 590 nm (H), total protein in BALF measured by Bradford assay (I), and percentage of EpCAM+ cells in BALF by flow cytometry (J). (K) Representative microscope images of BALF cytospins stained with Diff-Quik, periodic acid–Schiff (PAS), and Oil Red O. Scale bars, 100 µm. The data represent the mean ± SEM from n = 4–7 mice (6–12 wk old)/genotype, ≥ 5 independent exps. *, P < 0.05; **, P < 0.01; ***, P < 0.001; Student’s two-tailed t tests. Lymph, lymphocytes; Mono, monocytes; Eos, eosinophils; SSC, side scatter.

