Figure 5.
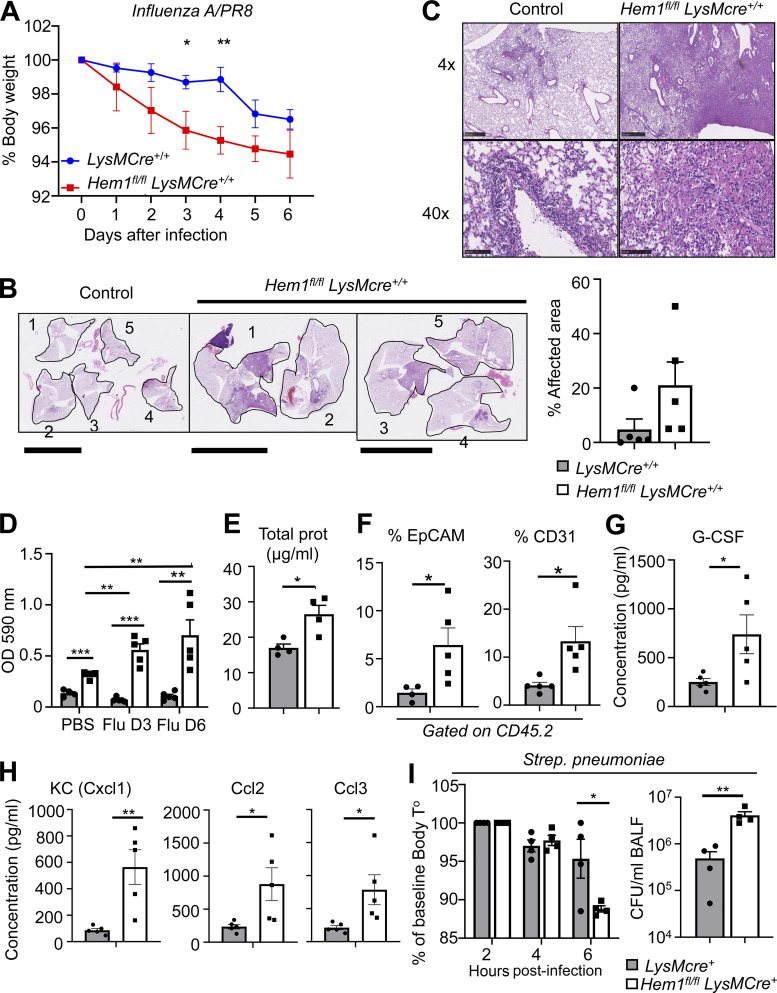
Myeloid cell–specific disruption of Hem1 increases sensitivity to IAV and pneumococcus challenge. (A–H) Hem1fl/flLysMCre+/+ and LysMCre+/+ control mice were infected with IAV PR8 strain or PBS control via o.p. route and were monitored for 6 dpi. (A) Hem1fl/flLysMCre+/+ mice exhibited increased BW loss in response to IAV infection compared with control mice. (B and C) H&E staining of lung tissue 6 dpi. Low-power images of single lung lobes from five control mice (1–5) and five Hem1fl/flLysMCre+/+ mice (1–5; B). Scale bars in B, 10 mm. Bar graph shows the percentage of areas affected by inflammation. (C) 4× and 40× magnification of representative lung tissues showing increased lung inflammation and protein (pink). Scale bars in C, 500 µm (upper) and 100 µm (lower). Bar graphs showing OD of BALF after IAV instillation normalized to PBS instilled control (D), total protein in BALF 6 dpi (E), and percentage of EpCAM+ and CD31+ cells in BALF 6 dpi (F). (G and H) Concentrations of cytokines in BALF 6 dpi as measured by multiplex immunoassay. G-CSF, granulocyte colony-stimulating factor. (I) Hem1fl/flLysMCre+ and LysMCre+ control mice were infected with 2 × 10⁶ CFU of Spn via o.p. route. Bar graphs show body temperature (T°) changes during 6 h after infection (left) and Spn CFU in BALF 7 h after infection (right). Shown are mean ± SEM from n = 4–5 mice (6–12 wk old)/genotype, two independent exps. *, P < 0.05; **, P < 0.01; ***, P < 0.001; Student’s two-tailed t tests.

