
Figure 3.
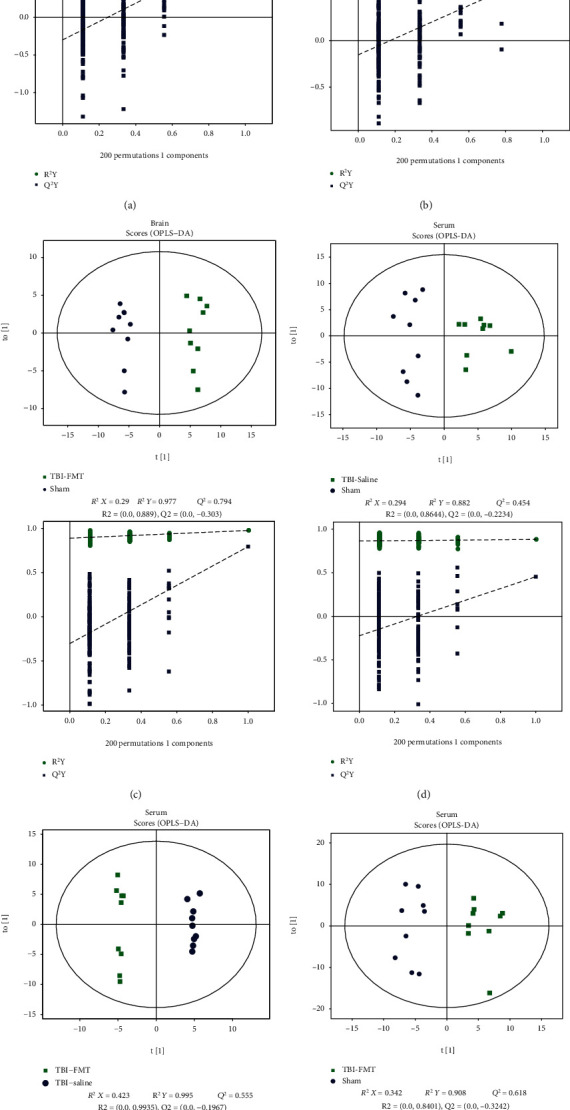
Brain and serum metabolomic analyses between the sham, TBI+saline, and TBI+FMT groups. (a–c) OPLS-DA model and permutation test of brain in the three groups. (a) TBI+saline versus sham. (b) TBI+FMT versus TBI+saline. (c) TBI+FMT versus sham. (d–f) OPLS-DA model and permutation test in serum of the three groups. (d). TBI+saline versus sham, (e) TBI+FMT versus TBI+saline. (f) TBI+FMT versus sham.