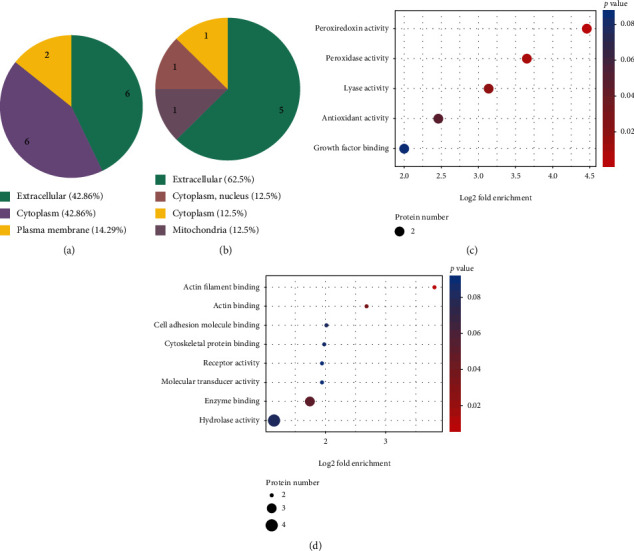
Figure 5.

Serum proteomic analysis between the TBI+FMT and TBI+saline groups. (a) The most significantly enriched cellular components of the upregulated proteins between the TBI+FMT and TBI+saline groups. (b) The most significantly enriched cellular components of the downregulated proteins between the TBI+FMT and TBI+saline groups (c). The upregulated proteins of GO enrichment analysis of different proteins from the TBI+FMT and TBI+saline groups. (d) The downregulated proteins of GO enrichment analysis of different proteins from the TBI+FMT and TBI+saline groups.
