Figure 3.

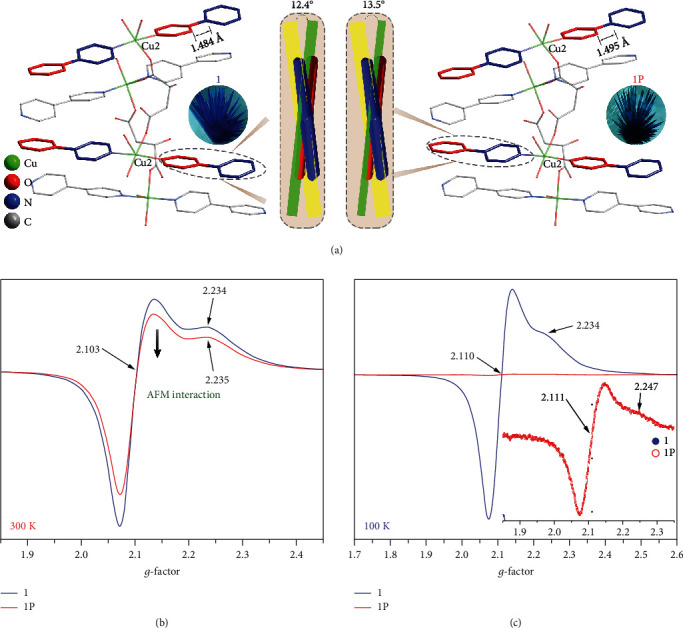
(a) Structure difference between 1 and 1P at 100 K. The solid-state EPR spectra of 1 and 1P at 300 K (b) and 100 K (c). Insert: enlarged sized EPR signal of 1P at 100 K.

(a) Structure difference between 1 and 1P at 100 K. The solid-state EPR spectra of 1 and 1P at 300 K (b) and 100 K (c). Insert: enlarged sized EPR signal of 1P at 100 K.