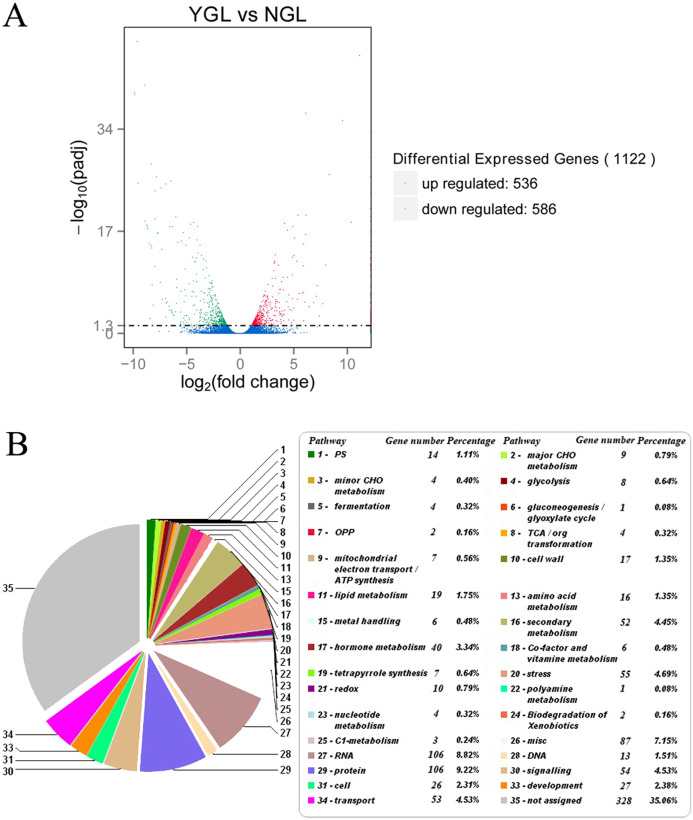
Figure 3. Differentially expressed genes and its enriched metabolic pathways between the yellow-green leaf mutant and the normal green leaf inbred line.
(A) Indicated differentially expressed genes between the yellow-green leaf mutant and the normal green leaf inbred line. Differentially expressed genes were selected by q-value < 0.005 & |log2 (fold change)| > 1. The X axis indicates gene expression changes in different samples, and the Y axis indicates the significant degree of gene expression changes. Scattered points represent each gene, the red dots represent differentially up-regulated genes, the green dots represent differentially down-regulated genes, and the blue dots represent no significant difference gene. YGL, yellow-green leaf mutant; NGL, normal green leaf inbred line; −log10 (padj), the corrected p-value (padj < 0.05). (B) Showed the pie chart of enriched metabolic pathways of genes differentially expressed in the yellow-green leaf mutant and the normal green leaf inbred line. The pie chart was generated by submission of the differentially expressed genes to the online Mercator sequence annotation tool (http://www.plabipd.de/portal/mercator-sequence-annotation).

