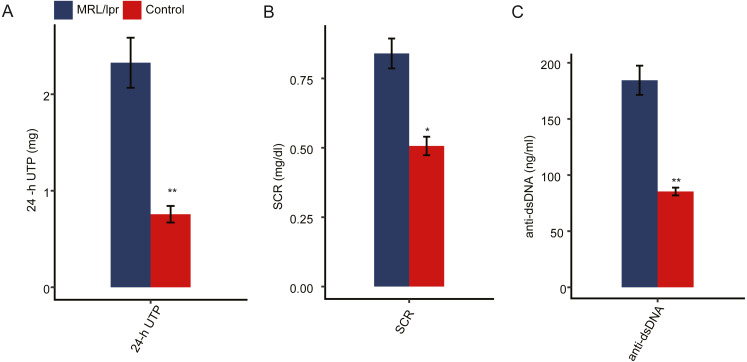
Figure 1. Pathologic characteristics of the lupus nephritis mouse model.
(A) Quantitative analysis of 24-hour urinary total protein (24-h UTP). (B) Quantitative analysis of serum creatinine concentration (SCR). (C) Quantitative analysis of serum anti-double-stranded DNA antibody titers (anti-ds-DNA). N = 3 for each group. Data are presented as the mean ± standard deviation (SD). Student’s t-test was performed to compare LN mice and controls with the significance set at a P value of less than 0.05. *P < 0.05, **P < 0.01.

