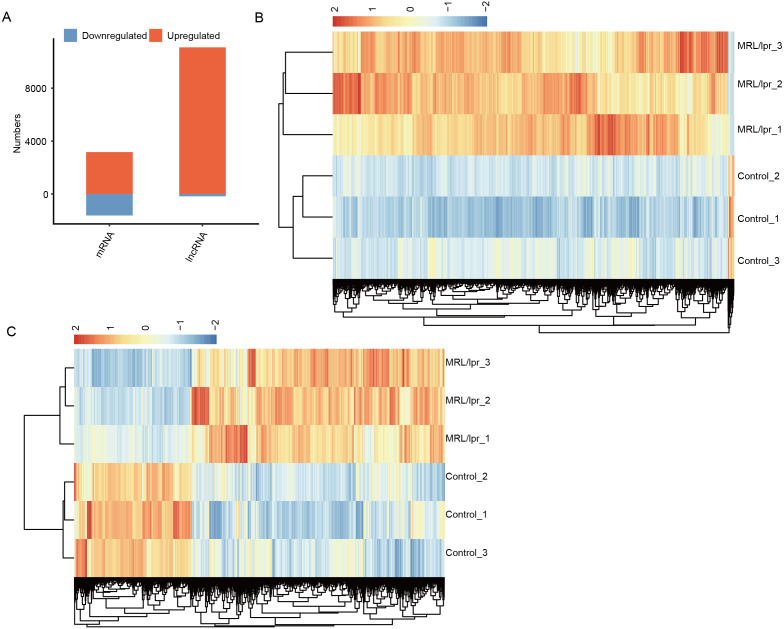
Figure 3. Identification of the differentially expressed mRNAs between the two groups.
(A) Distribution of the number of upregulated and downregulated mRNAs and lncRNAs between LN and control mice. (B) Hierarchical clustering and heatmap of six samples based on all differentially expressed lncRNAs. (C) Hierarchical clustering heatmap of all samples based on all the differentially expressed mRNAs.

