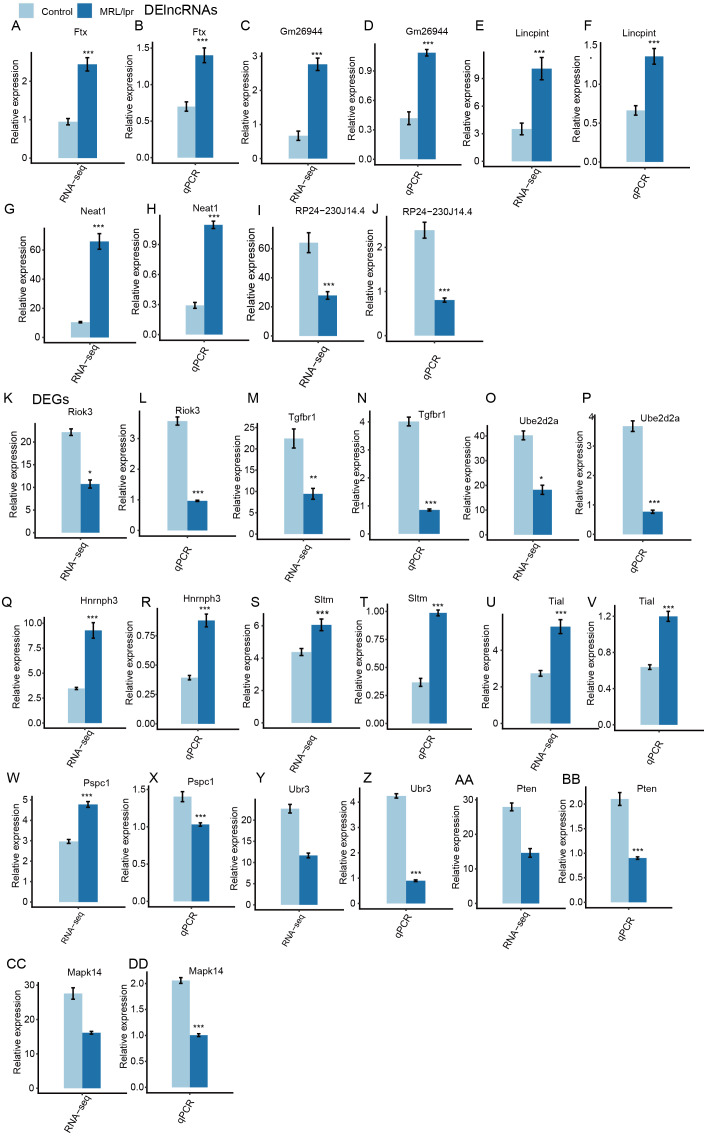
Figure 4. RT-qPCR validation of DEGs and DElncRNAs.
Relative expression levels of DElncRNAs (A–J) and DEGs (K–DD) by RNA-seq (FPKM) and RT-qPCR. Data are presented as the mean ± standard deviation (SD). Student’s t-test was performed to compare LN and control mice with the significance set at a P value of less than 0.05. *P < 0.05, **P < 0.01.

