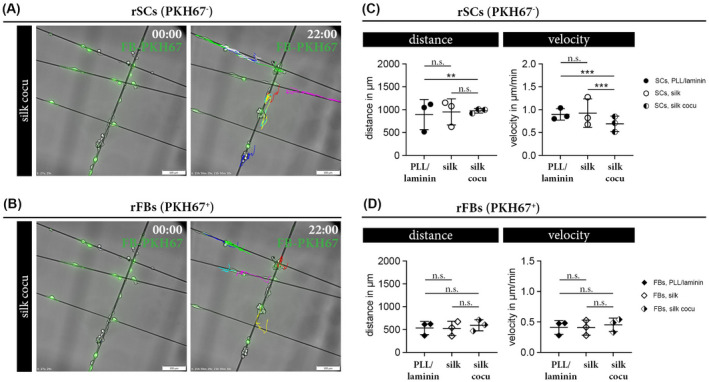
FIGURE 7.

Comparison of the migratory behavior of rSC and rFB co‐cultures. (A, B) Representative overlay image of phase contrast and corresponding green fluorescent channel visualizes PKH67− rSCs (A) and PKH67+ rFBs (B) in co‐cultures on silk at the start (00:00) and end (22:00) of live cell imaging. Colored trajectories illustrate the tracking results for PKH67− rSCs (A) and PKH67+ rFBs (B) after 22 hours. (C, D)Diagrams depict the covered distance in µm and the velocity in µm/min ± SD of rSCs (n = 3) (C) and rFBs (n = 3) (D) cultured on PLL/laminin, silk, and silk co‐cultures; n.s. (not significant), **P‐value < .01, ***P‐value < .001
