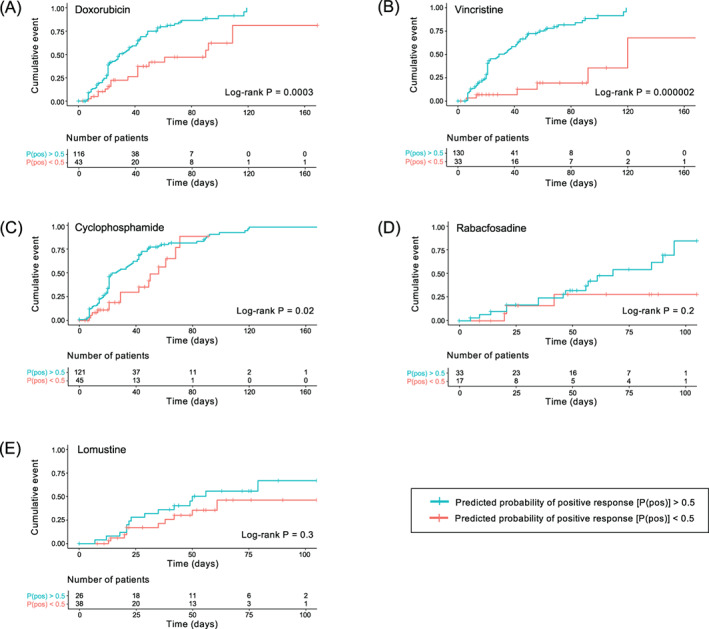
FIGURE 3.

Cumulative incidence curves of time to complete response. All patients received at least one dose of A, doxorubicin; B, vincristine; C, cyclophosphamide; D, rabacfosadine and E, lomustine after the ex vivo chemosensitivity assay sampling date. Patient groups were dichotomized at 50% predicted probability of positive response. The bottom tables show number of patients who have not achieved complete response or been censored at a given time point [Colour figure can be viewed at wileyonlinelibrary.com]
