
FIGURE 2.
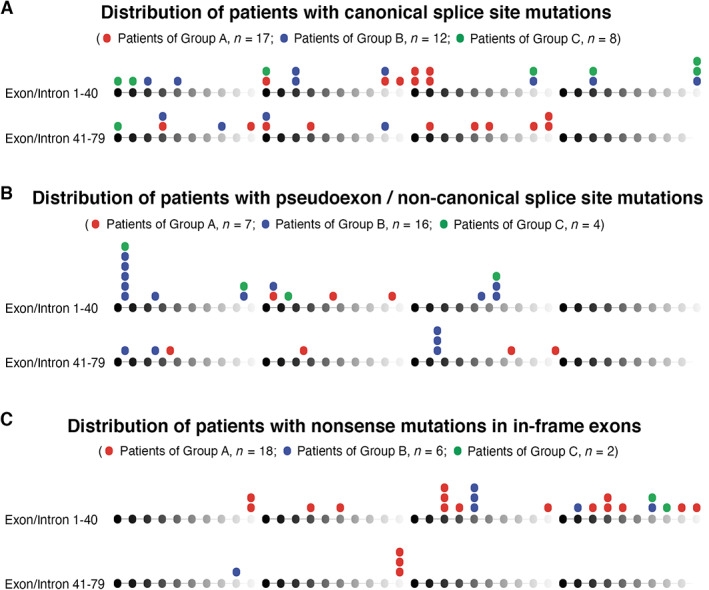
Genomic distribution of the analyzed mutations based on the quantity of dystrophin expressed. (A) Canonical splice site mutations. (B) Pseudoexon and noncanonical splice site mutations. (C) Nonsense mutations within “in‐frame” exons. DMD exons and introns 1 to 79 are symbolized by spheres and connecting lines from black to gray in repeats of 10. Mutations of the patients of group A, group B, and group C appear on the top of the respective exons/introns. Each sphere represents 1 patient.