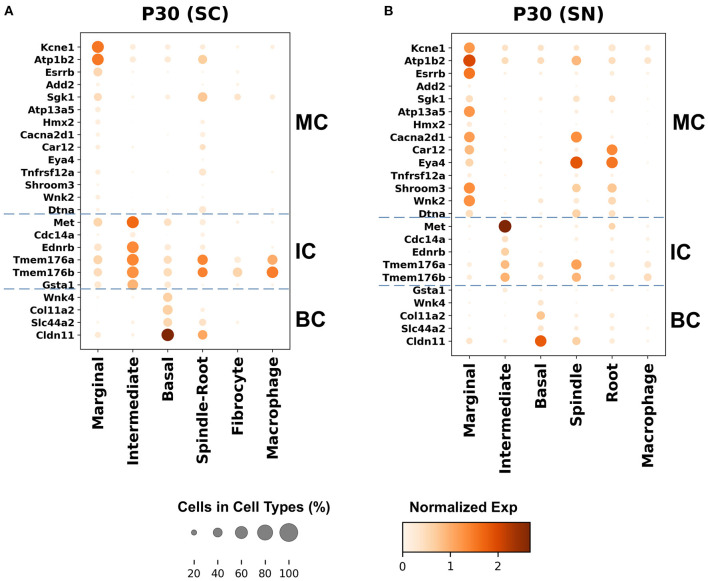
Figure 5.
Top differentially expressed Meniere's disease genes in the adult SV. (A) Top differentially expressed genes in the single-cell RNA-seq dataset. (B) Top differentially expressed genes in the single-nucleus RNA-seq dataset. Cell types are displayed along the horizontal axis and genes are displayed along the vertical axis. The size of the dot corresponds to the proportion of cells expressing the given gene (see legend). The darker the color of the dot, the greater the level of expression of the given gene (see scale bar).

