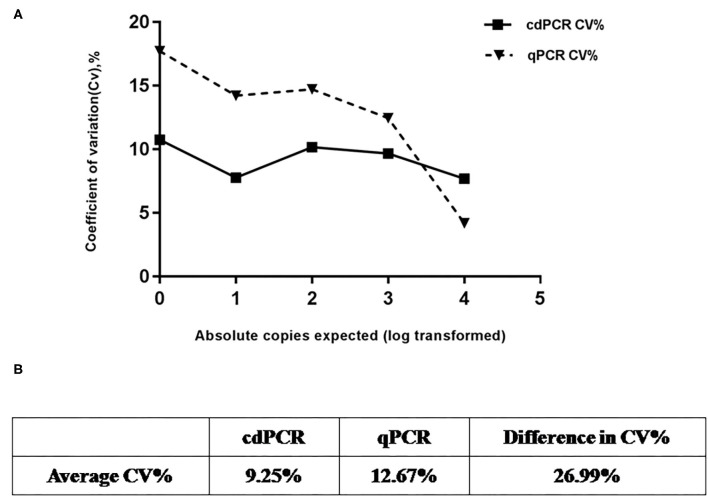
Figure 7.
Repeatability analysis. (A) Trend line comparing coefficient of variation (CV%) for cdPCR and qPCR at different concentration points. The square with the full line stands for CV % of cdPCR and the triangle with the dotted line indicated as the CV% of qPCR. (B) Table shows that average CV% value of cdPCR (9.25%) is lower than that of qPCR (12.67%).

