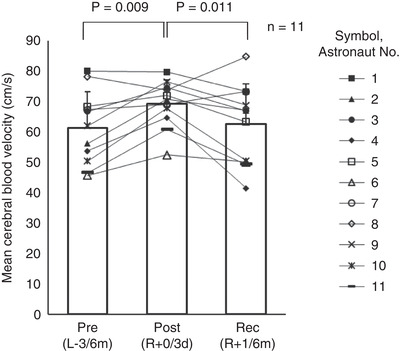
Figure 1. Mean cerebral blood velocity in the supine position (n = 11).

Pre(L−3/6m), preflight (3–6 months before launch); Post(R+0/3d), postflight (0–3 days after landing); Rec(R+1/6m), recovery (1–6 months after landing). A one‐way repeated measures ANOVA for differences at three time points was used (P = 0.007), and, the Student‐Newman‐Keuls method was used to determine where significant differences occurred (Pre(L−3/6m)vs. Post(R+0/3d),P = 0.009; Pre(L‐3/6m)vs. Rec(R+1/6m),P = 0.608; Post(R+0/3d)vs. Rec(R+1/6m),P = 0.011).
