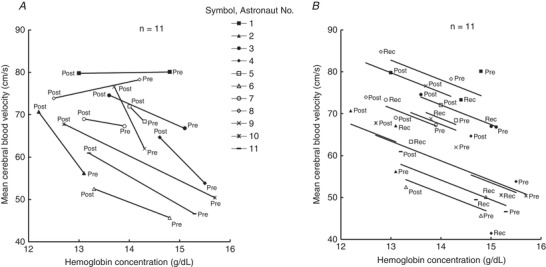
Figure 3. Relationship between haemoglobin concentration and mean cerebral blood velocity (n = 11).

A, before (Pre) and shortly after (Post) spaceflight.B, repeated measure correlation analysis between haemoglobin concentration and mean cerebral blood velocity for three data collection points (Pre, Post and Recovery (Rec)). Each marker represents the measured values of each astronaut, and the total of 33 data (three data collection points × 11 astronauts) are shown. Solid lines represent the regression line of each astronaut calculated by repeated measures correlation for determining the common within‐individual association (Bakdash & Marusich2017).r = −0.589 (dF = 21, 95% CI [−0.814, −0.212],P = 0.003), the regression coefficient = −4.68.
