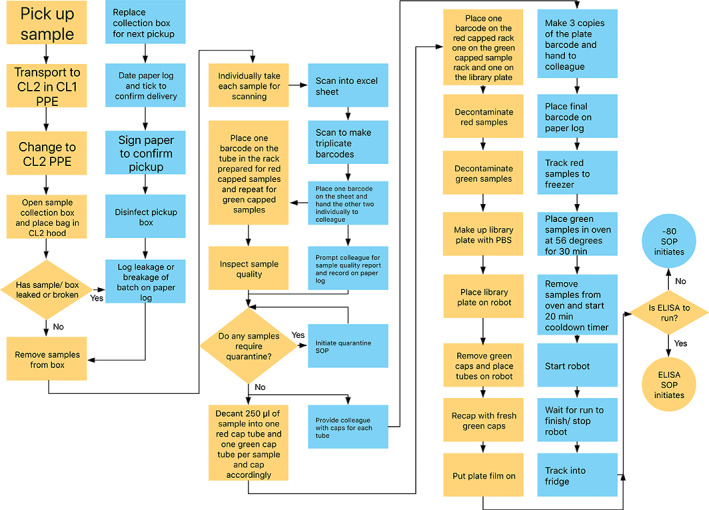
Figure 2.

The flowchart outlines the steps taken along the pipeline from the moment of sample receipt to running the assay. The yellow pathway follows the person performing the tasks and making decisions. The blue pathway indicates a second person who checks the action of the person following the yellow pathway, as well as, tracking the sample manually along the pipeline. Rectangles denote actions, diamonds indicate decision points and circles provide the two end points.
