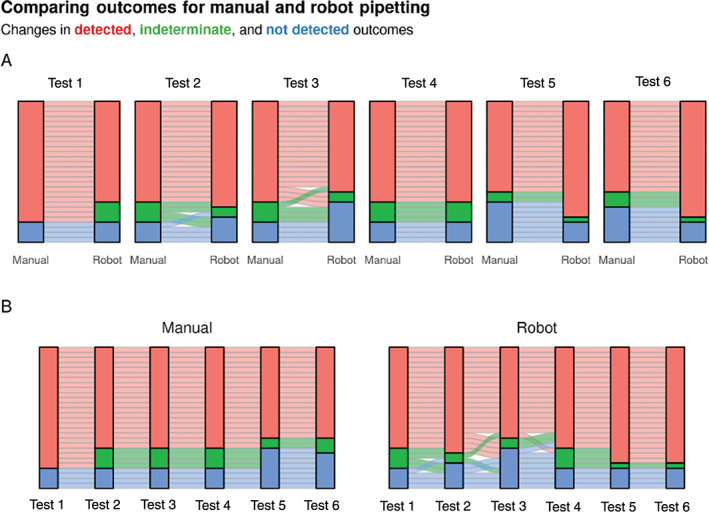
Figure 4.

The reproducibility between robot and manual pipetting. (A) Alluvial plots showing how the outcome for each well changes when dispensed manually or with the robot. Separate subplots are drawn for each experimental run. Each horizontal ribbon represents a single well and is colored by its manual pipetting outcome. (B) The same data as in A showing how the outcome for each well changes between experimental runs. Separate subplots show manual and robot pipetting data.
