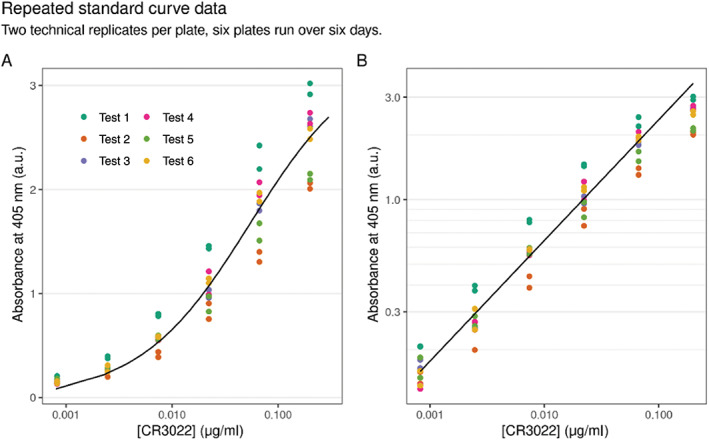
Figure 5.

Concentration of the anti‐S1 spike protein antibody CR3022 (the assay positive control antibody) against absorbance at 405 nm after performing six independent ELISAs. (A) is plotted on a natural scale and (B) is plotted on a semi‐log scale. Two technical replicates per plate are shown. Note that except for the saturating concentration the relationship between log concentration and log absorbance is linear which indicates dilution linearity.
