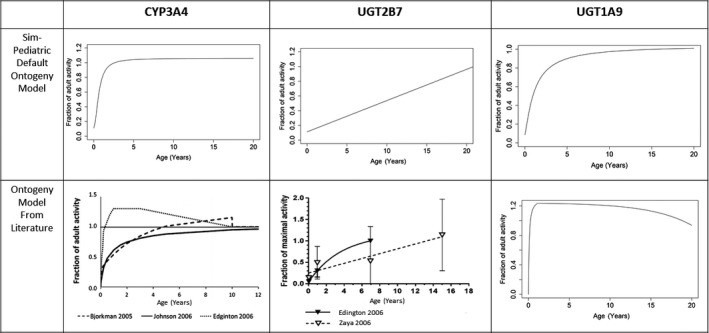
Figure 2.

Comparison of the metabolic enzyme ontogeny models in Simcyp and in the literature. “Sim‐Pediatric” default ontogeny profiles (scenario 1) for CYP3A4, UGT2B7, and UGT1A9 and recent data based on literature (scenario 2) for CYP3A4, UGT2B7, and UGT1A9 are compared. CYP, cytochrome P450; UGT, UDP‐glucuronosyltransferase.
