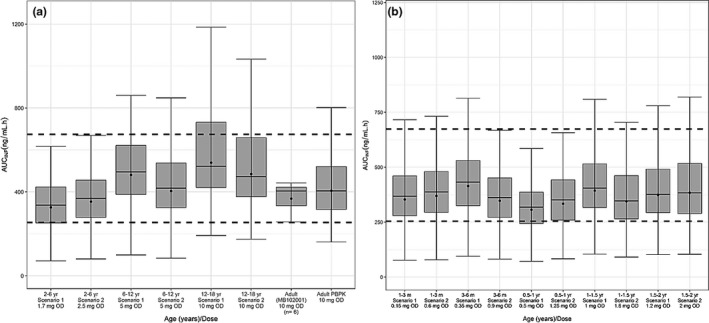
Figure 4.

Boxplot of dapagliflozin plasma exposure from predicted optimal OD using a PBPK model in virtual pediatric populations using two different uridine diphosphate‐glucuronosyltransferase 1A9 ontogeny models in pediatric age groups (a) 2 to 18 years old and (b) 1 month to 2 years old. The dotted black lines indicate lower 2.5% and upper 97.5% of exposure reported in healthy adults after a 10‐mg oral dapagliflozin. Closed circles indicate geometric means; line indicates median. AUCINF, area under the curve extrapolated from administration to infinity; m, months old; OD, oral dose; PBPK, physiologically based pharmacokinetic; yr, years old.
