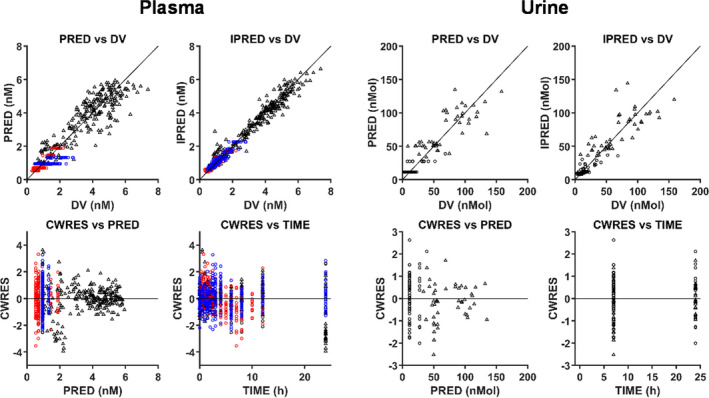
Figure 3.

Goodness‐of‐fit (GOF) plots for mechanistic population PBPK modeling of CPI plasma and urine data. Colors represent clinical studies: blue = study 1; red = study 2; and black = study 3. Circles and triangles represent occasions with or without rifampicin administration, respectively. Solid lines are reference lines. The CPI model with ksyn in the blood (central) compartment was used for the simulation. CPI, coproporphyrin I; CWRES, conditional weighted residuals; DV, observed data; IPRED, individual prediction; PRED, population prediction.
