. 2021 Feb 19;129(2):027005. doi: 10.1289/EHP7297

Figure 4.

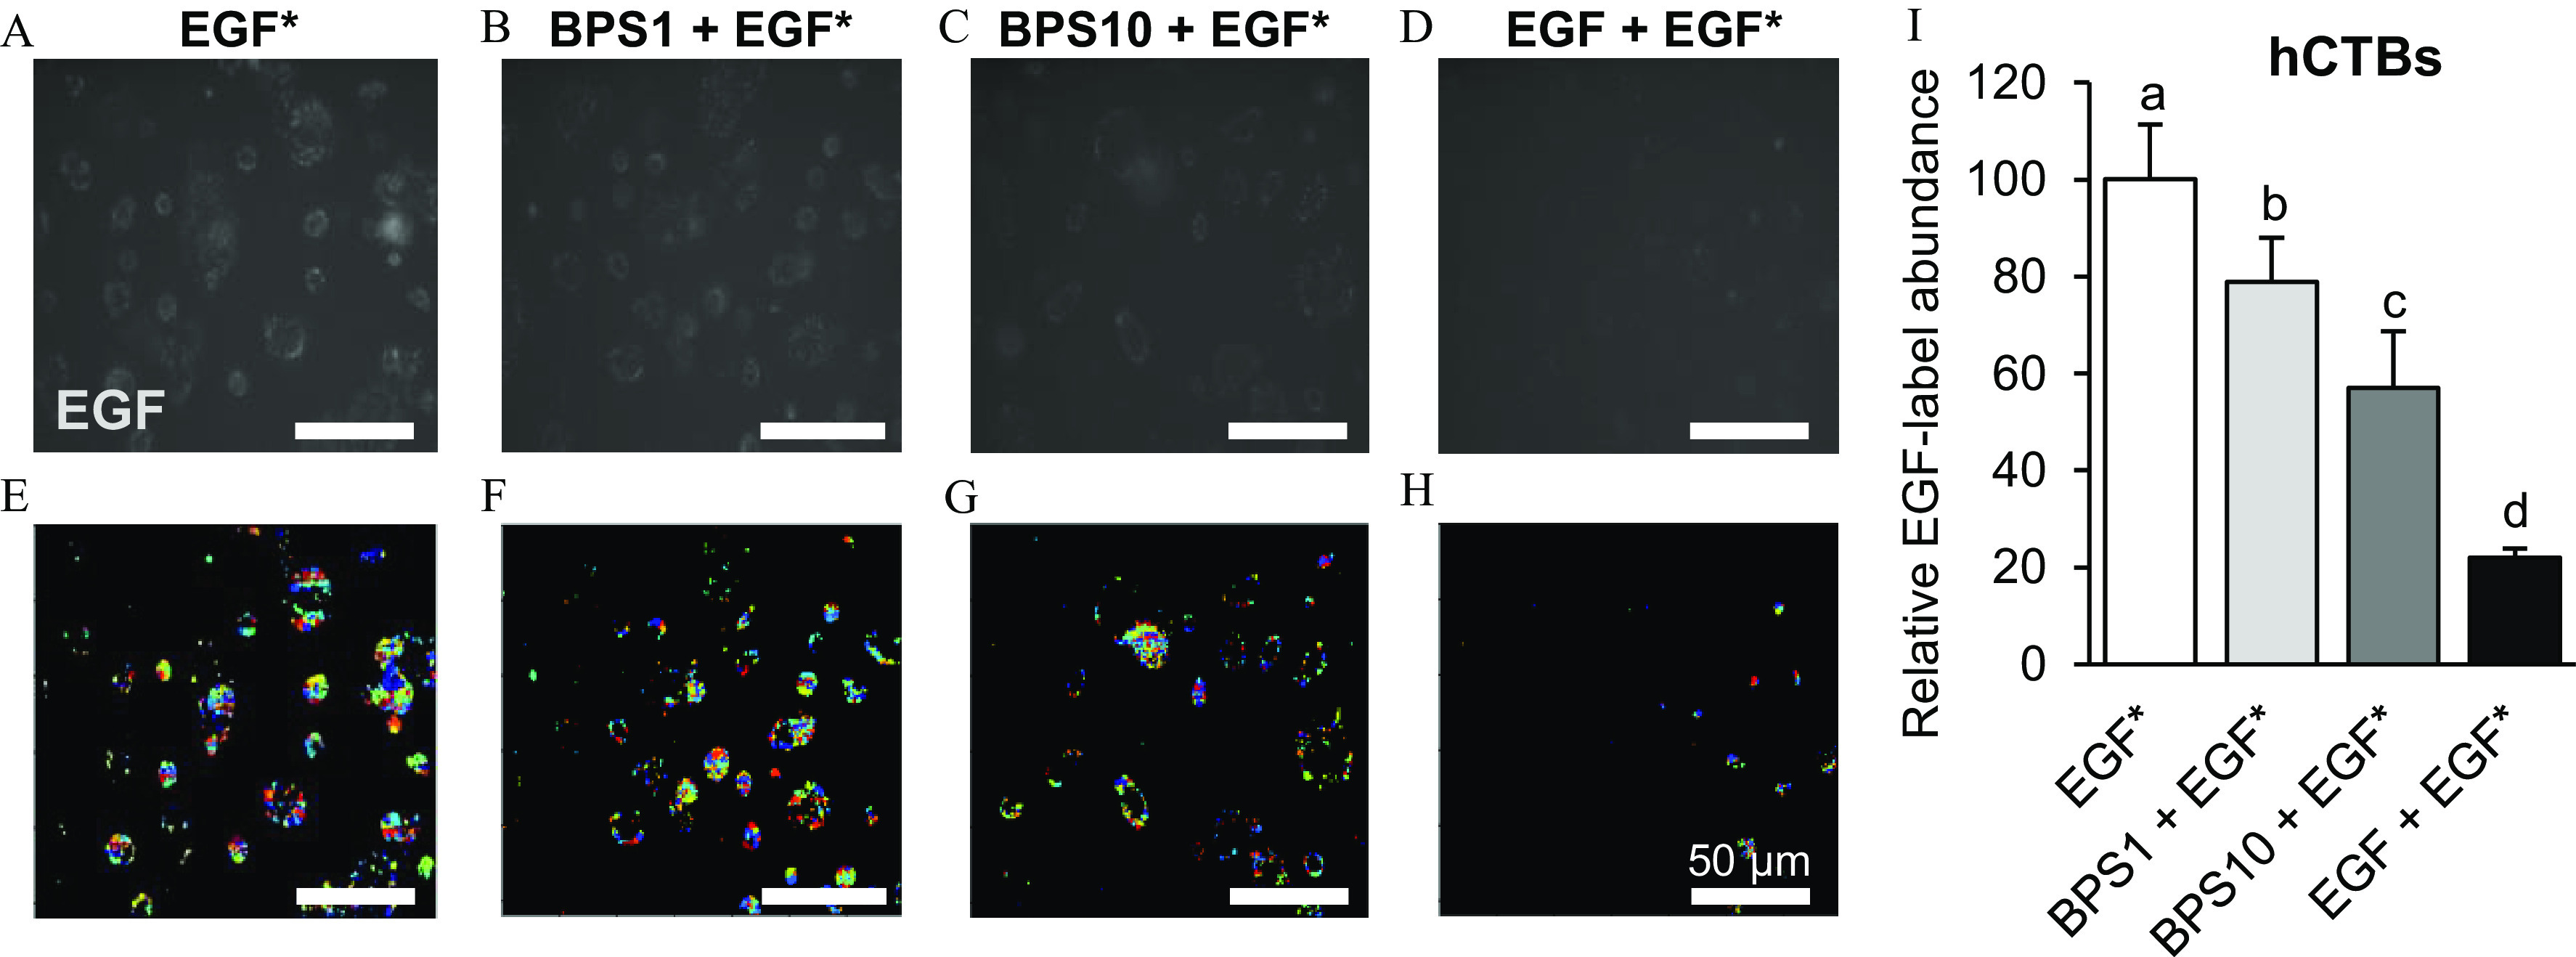
Figures 4A, 4B, 4C, 4D, 4E, 4F, 4G, and 4H are a set of internalization images of the human cytotrophoblast cell lines, and Figure 4I is a bar graph. In Figures 4A, 4B, 4C, 4D, 4E, 4F, 4G, and 4H, images of human cytotrophoblasts showing the effects of bisphenol S on epidermal growth factor with 50 micrometers are presented. Epidermal growth factor is exposed to 100 nanograms per alexa fluor 647-labeled epidermal growth factor (Figures 4A,E); bisphenol S 1 plus epidermal growth factor is exposed to 1 microgram per milliliter bisphenol S plus 100 nanograms per milliliter epidermal growth factor (Figures 4B,F); bisphenol S 10 plus epidermal growth factor is exposed to 10 micrograms per milliliter bisphenol S plus 100 nanograms per milliliter epidermal growth factor (Figure 4C,G); and epidermal growth factor plus epidermal growth factor is exposed to 100 nanograms per milliliter nonlabled epidermal growth factor plus 100 nanograms per milliliter epidermal growth factor (Figure 4D,H). The cells were exposed for 5 minutes. In Figure 4I, the bar graph titled human cytotrophoblasts plots relative epidermal growth factor-label abundance, ranging from 0 to 120 in increments of 20 (y-axis) across epidermal growth factor, bisphenol S 1 plus epidermal growth factor, bisphenol S 10 plus epidermal growth factor, and epidermal growth factor plus epidermal growth factor (x-axis).

Effect of BPS on EGF internalization in human cytotrophoblasts (hCTBs). (A–D) Representative images of EGF in hCTBs, (E–H) their respective post-processed images, and (I) quantification (mean±SEM) following exposure to EGF* (100 ng/Alexa Fluor 647-labeled EGF) (A,E); BPS1+EGF* (1μg/mL BPS+100 ng/mL EGF*) (B,F); BPS10+EGF* (10μg/mL BPS+100 ng/mL EGF*) (C,G); and EGF+EGF* (100 ng/mL nonlabeled EGF+100 ng/mL EGF*) (D,H). Images were taken 1 h after a 5-min exposure. The results were normalized by the number of cells and are expressed as the percentage of the EGF* group. n=4 replicates/group. A generalized linear model was used to compare treatments. Different letters denote statistical differences among treatment groups at p<0.05. Colors in the processed images indicate the individual fluorescent signals detected by the software used to quantify the EGF internalization. Note: BPS, bisphenol S; EGF, epidermal growth factor; SEM, standard error of the mean.