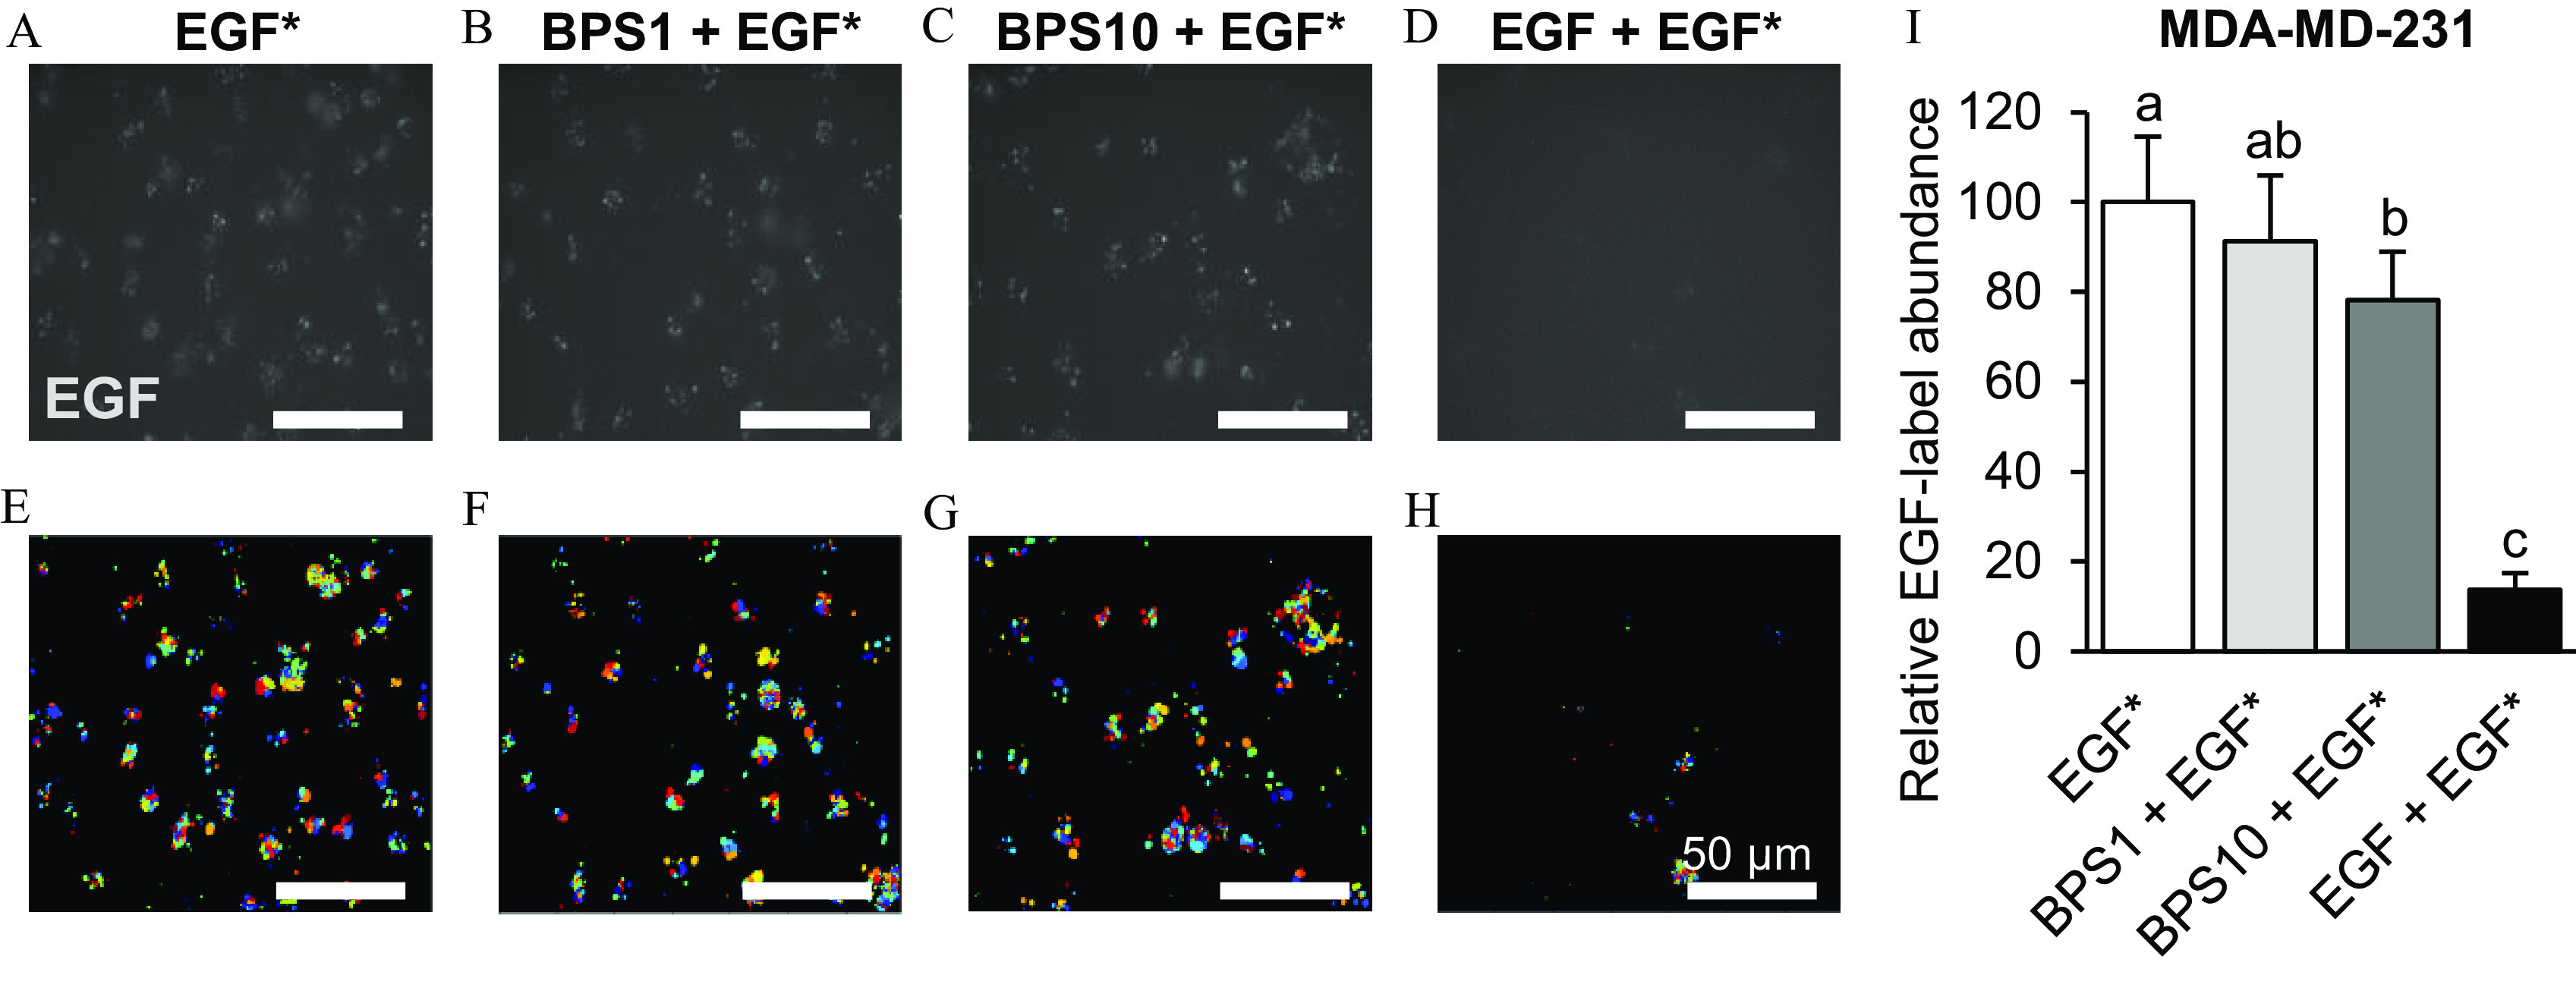
Figure 5.

Effect of BPS on EGF internalization in MDA-MD-231 cells. (A–D) Representative images of EGF in MDA-MD-231 cells, (E-H) their respective post-processed images, and (I) quantification () following exposure to EGF* (/Alexa Fluor 647-labeled EGF) (A,E); * ( EGF*) (B,F); * ( EGF*) (C,G); and * ( nonlabeled EGF*) (D,H). Images were taken 1 h after a 5-min exposure. The results were normalized by the number of cells and are expressed as the percentage of the EGF* group. replicates/group. A generalized linear model was used to compare treatments. Different letters denote statistical differences among treatment groups at . Colors in the processed images indicate the individual fluorescent signals detected by the software used to quantify the EGF internalization. Note: BPS, bisphenol S; EGF, epidermal growth factor; SEM, standard error of the mean.
