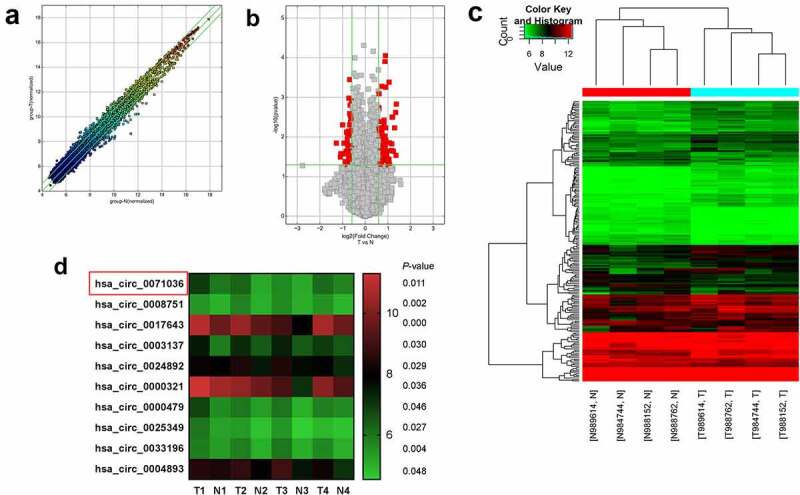
Figure 1.

Expression profiles of circRNAs in PDAC. (a) The scatter plot visualizes the circRNA expression variation between PDAC and adjacent normal pancreas tissues. The space between two bar lines indicated more than a 1.5-fold change. (b) The volcano plot visualizes the expression of circRNA between PDAC and adjacent normal pancreas tissues. The red dots represent the differentially expressed circRNAs with statistical significance. (c) The hierarchical clustering of differentially expressed circRNAs and the dendrogram show the relationships among the expression levels in the samples. (d) The heat maps displayed the 10 most increased circRNAs
