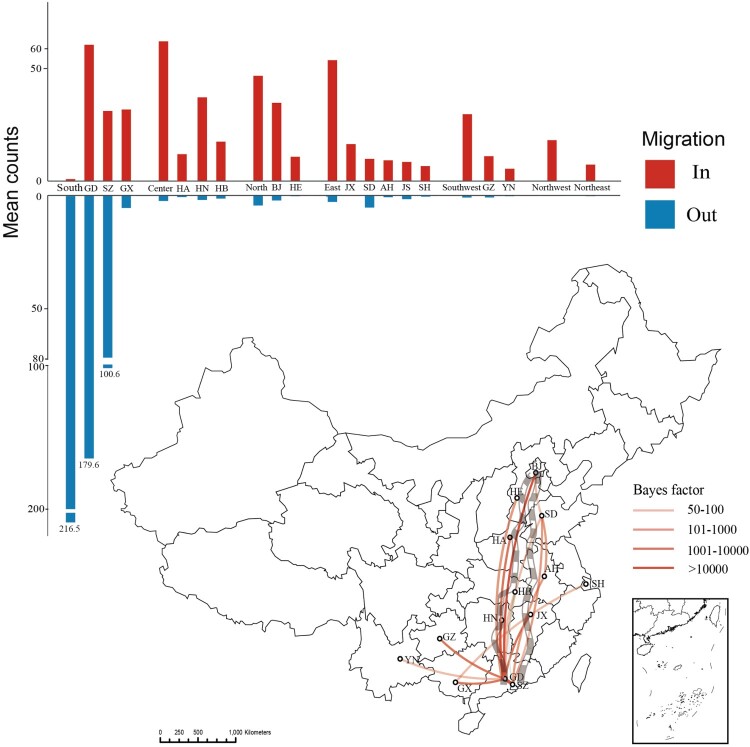
Figure 3.
The bar chart shows the input (in) and output (out) of CRF55_01B by regions and provinces. The map shows the provinces where CRF55_01B is most heavily propagated in the BSSVS analysis. The transmission relationships of provinces between BF ≥ 50 and posterior probability ≥ 0.8 are shown in the figure. Mean counts are the average counts from A to B calculated by the MCC trees. South China has very little inputs in the bar, but GD and SZ have a lot. This is because south China mean counts from other areas. GD and SZ import more because they spread more to each other.

