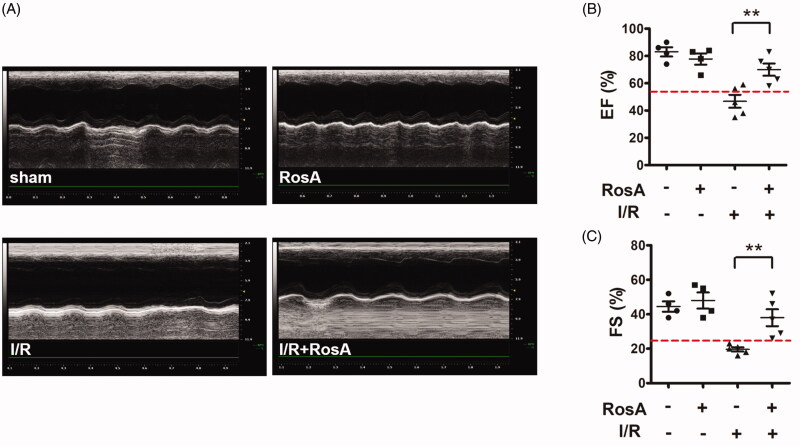
Figure 3.
Effects of RosA on cardiac dysfunction. (A) Representative echocardiographs showing cardiac function from the various groups. (B) EF and (C) FS measured by echocardiography. Data are expressed as the mean ± S.D. (n = 4–5). Significance was determined by ANOVA followed by Tukey’s test. **p < 0.01 vs. Vehicle + I/R. EF: ejection fraction; FS: fractional shortening.

