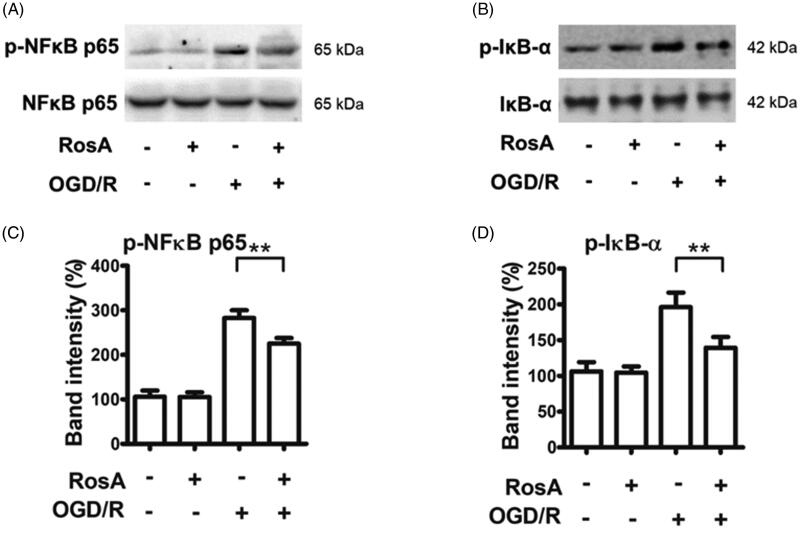
Figure 9.
RosA reduced the protein levels of p-NFκB and p-IκB-α. (A) RosA reduced the protein level of p-NFκB. (B) Statistical results of RosA reducing the protein level of p-NFκB. (C) RosA reduced the protein levels of p-IκB-α. (D) Statistical results of RosA reducing the protein level of p-IκB-α. Data are expressed as the mean ± S.D. (n = 3). Significance was determined by ANOVA followed by Tukey’s test. **p < 0.01 vs. Vehicle + OGD/R.

