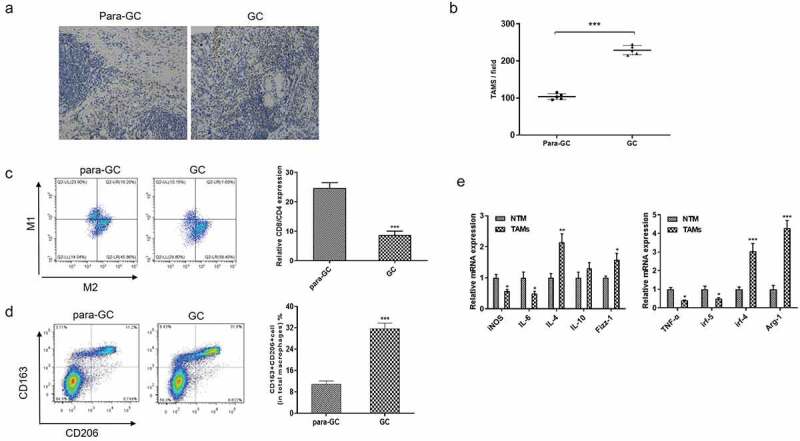
Figure 1.

The proportion of M2 macrophage was increased in human GC tissues. (A-B). Immunohistochemistry analyze of CD68 expression level in para-GC tissues and GC tissues (n = 5). Bar scan = 100 μm. (C-D). Flow cytometry analysis of M1 and M2 macrophage markers in para-GC tissues and GC tissues. (E). qRT-PCR analyze of M1 and M2 macrophage markers in tumor-associated macrophage (TAMs) compared to normal tissues macrophage. *p < 0.05, **p < 0.01, ***p < 0.001 vs control. Data are displayed as mean ± SEM
