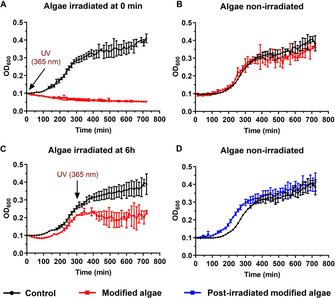
Figure 3.

B. subtilis growth curves in the presence of functionalized algae with VancphotoN3 (5, red curve) or in the absence of the algae as control experiment (black curve). DBCO (1) concentration for the algae functionalization was 100 μm and VancphotoN3 (5) was 5 μm. A) The samples were UVA1‐irradiated at a wavelength of 365 nm for 5 min. B) The samples were not exposed to a UVA1 irradiation. C) The samples were UVA1‐irradiated at a wavelength of 365 nm for 5 min after 5 h of incubation. D) The functionalized algae with VancphotoN3, were UVA1‐irradiated at a wavelength of 365 nm for 5 min, the algae cells were washed with PBS (3x) and the resulting cells were incubated with B. subtilis. The growth curve of this experiment is displayed in blue. Data points adjusted to initial value 0.1 and represent mean value ±SD (n=3).
