
FIG. 3.
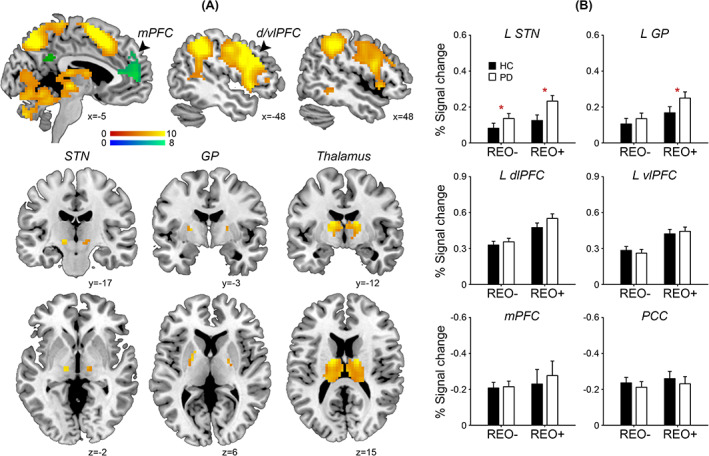
Group differences in regional activation. (A) Ordering‐related regional activation (warm colors) and deactivation (cool colors). Color scales indicate t values. Coordinates are in Montreal Neurological Institute and Hospital space. (B) Means and standard errors of the percent signal change in the regions of interest for “pure recall” (REO−) and “reorder & recall” trials (REO+) in patients with Parkinson's disease (PD) and healthy controls (HC). Asterisks indicate significant group differences (P < 0.05). L, left; mPFC, medial prefrontal cortex; d/vlPFC, dorsolateral/ventrolateral prefrontal cortex; PCC, posterior cingulate cortex; STN, subthalamic nucleus; GP, globus pallidus. [Color figure can be viewed at wileyonlinelibrary.com]