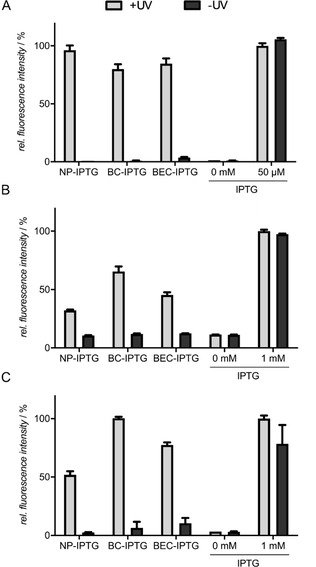
Figure 2.

Light‐controlled gene expression in A) E. coli Tuner(DE3)/pRhotHi‐2‐lacI‐EYFP, B) P. putida KT2440/pVLT33‐GFPmut3 and C) B. subtilis DB430/pHT01‐sfGFP using NP‐, BC‐, and BEC‐cIPTG. A) In vivo eYFP fluorescence (λ ex=508 nm, λ em=532 nm) of E. coli cultures supplemented with 50 μm of each cIPTG variant is shown in relation to a 50 μm IPTG (14) after 20 h (stationary growth phase). Induction was performed after 2.5 h by UV‐A light exposure at 365 nm (∼1 mW cm−2) for 30 min or the addition of 50 μm 14. B) In vivo GFPmut3 fluorescence (λ ex=508 nm, λ em=532 nm) of P. putida cultures supplemented with 1 mm of each cIPTG variant is shown in relation to a 1 mm IPTG (14) control after 20 h (stationary growth phase). Induction was performed after 3 h by UV‐A light exposure at 365 nm (∼1 mW cm−2) for 30 min or the addition of 1 mm 14. C) In vivo sfGFP fluorescence (λ ex=488 nm, λ em=520 nm) of cultures supplemented with 1 mm of each cIPTG variant is shown in relation to a 1 mm IPTG (14) control after 20 h. Induction was performed after 5 h by UV‐A light exposure at 365 nm (∼1 mW cm−2) for 30 min or the addition of 1 mm 14. In vivo fluorescence intensities were normalized to cell densities, and values are means of triplicate measurements. Error bars indicate the standard deviations.
