
FIGURE 2.
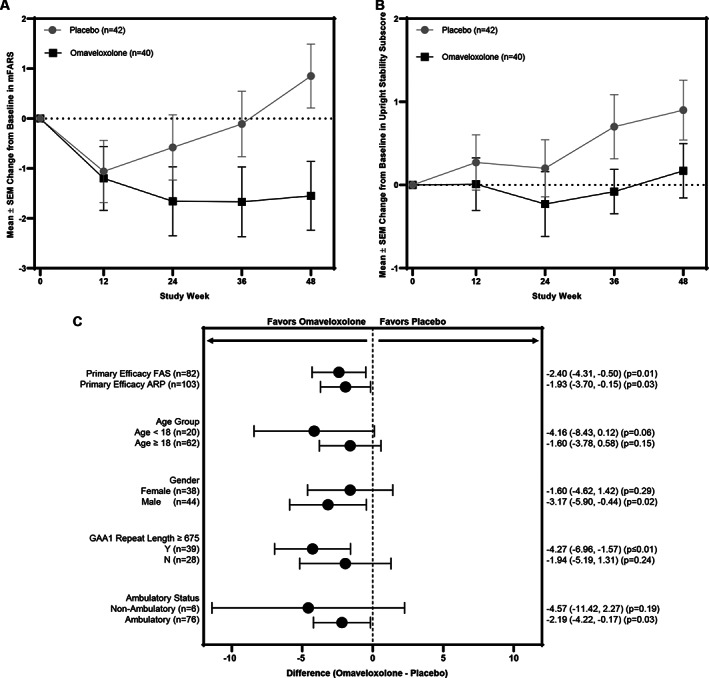
(A) Mean changes from baseline in modified Friedrich's Ataxia Rating Scale (mFARS) score over time in the full analysis set (FAS) for patients randomized to omaveloxolone (n = 40) or placebo (n = 42). The change from baseline in mFARS and p value was estimated using mixed models repeated measures (MMRM) analysis. Significant differences in the change from baseline in mFARS in the omaveloxolone group, as compared with the placebo group, were observed at week 48 (p = 0.014). The error bars indicate standard errors. SEM = standard error of the mean. (B) Mean changes from baseline in the upright stability scores (Section E) of mFARS over time estimated using MMRM analysis. (C) Forest plot representing the difference between omaveloxolone and placebo treatment groups for the change from baseline in mFARS score at week 48 for the following prespecified analysis populations: FAS (n = 82), all randomized patients (ARP; n = 103), and prespecified subgroups. The change from baseline at week 48 was estimated using MMRM analysis, and each p value was estimated from a test comparing the difference in means between the omaveloxolone and placebo groups.