
FIGURE 3.
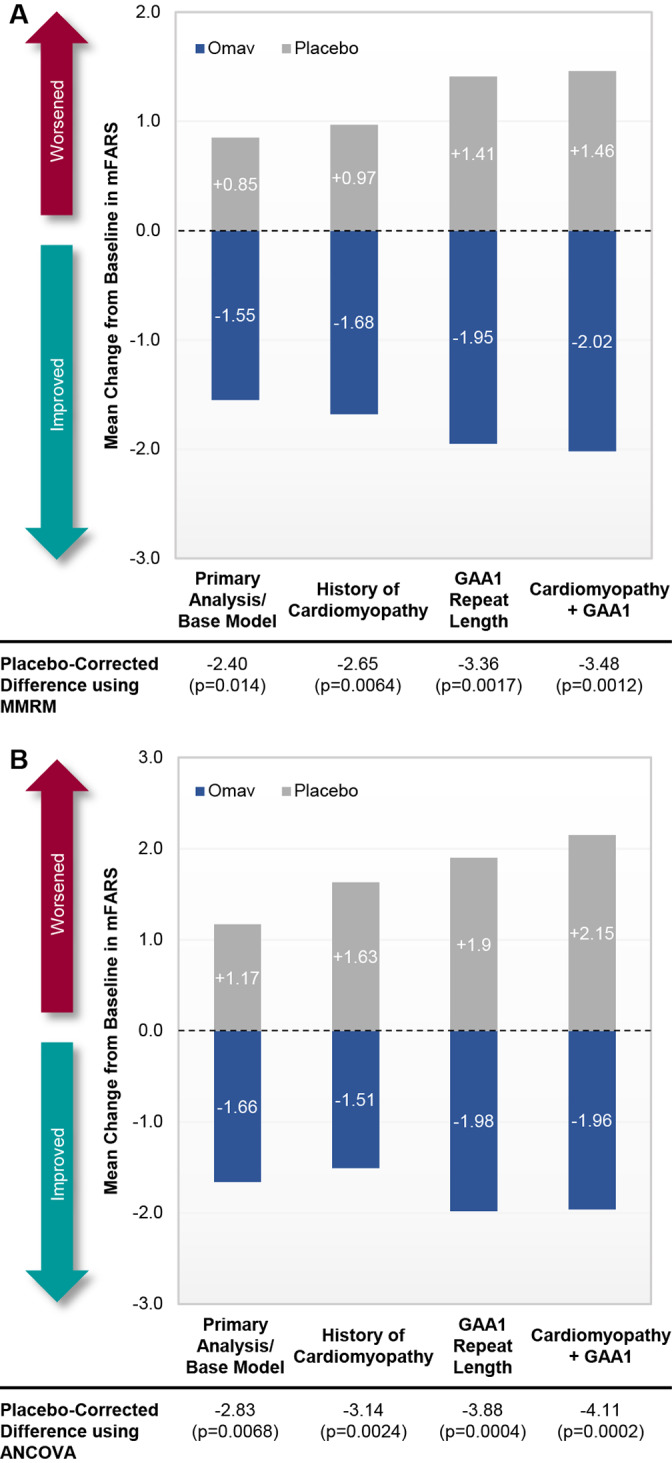
Post hoc analyses of change from baseline in modified Friedreich's Ataxia Rating Scale (mFARS) at week 48 with additional baseline covariates (full analysis set population). Data are presented as bar graphs comparing mean changes from baseline in mFARS at week 48 for patients randomized to omaveloxolone (Omav; n = 40) or placebo (n = 42) using the primary mixed model repeated measures (MMRM) methodology (A) or analysis of covariance (ANCOVA; B) with the inclusion of history of cardiomyopathy, GAA1 repeat length, or history of cardiomyopathy and GAA1 repeat length included as covariates. Note that the model with GAA1 repeat length as a covariate includes only those patients with baseline GAA1 repeat length data (n = 31 for omaveloxolone and n = 36 for placebo). [Color figure can be viewed at www.annalsofneurology.org]