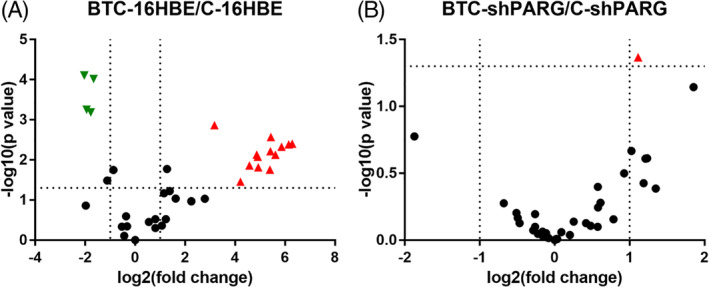
FIGURE 1.

PARG silencing down‐regulates H2B levels in BaP‐induced carcinogenesis. A, A volcano plot showing histone expression in BTC‐16HBE/C‐16HBE. B, A volcano plot showing histone expression in BTC‐shPARG/C‐shPARG. The red equilateral triangle represents the protein with significantly high expression, while the green inverted triangle represents the protein with significantly low expression [Color figure can be viewed at wileyonlinelibrary.com]
