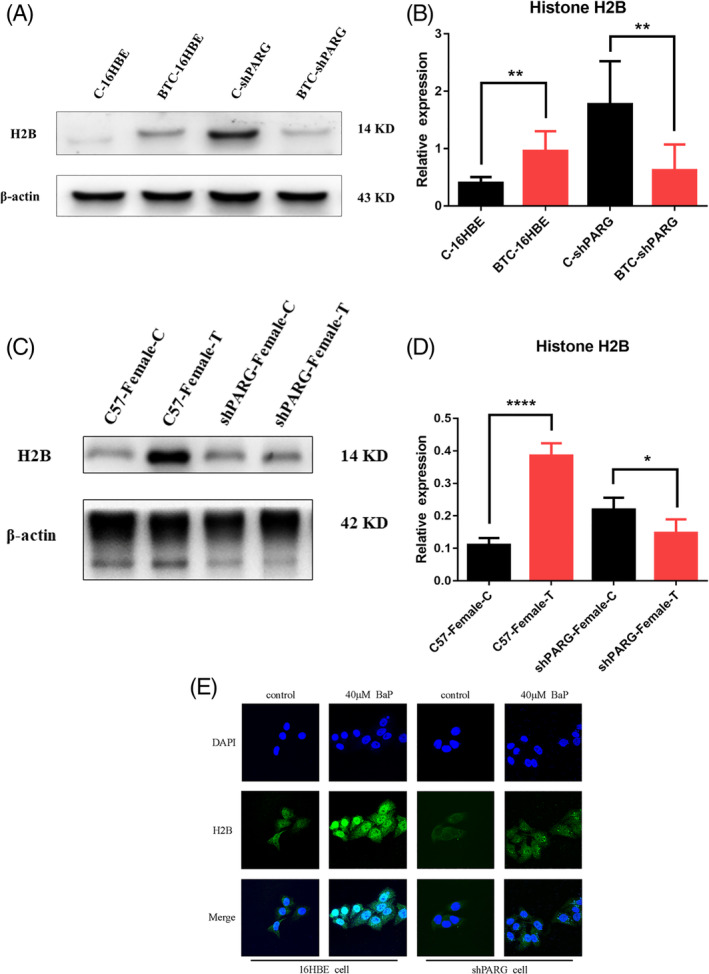
FIGURE 2.

Effects of PARG on the expression of H2B in BaP‐induced carcinogenesis. A, Western blot showing H2B expression in each cell. B,Histogram of the relative expression of H2B in each cell. C,Western blot showing H2B expression in mice. D, Histogram of the relative expression of H2B in each mice. E, Fluorescence intensity of H2B in each cell [Color figure can be viewed at wileyonlinelibrary.com]
