Fig. 3.

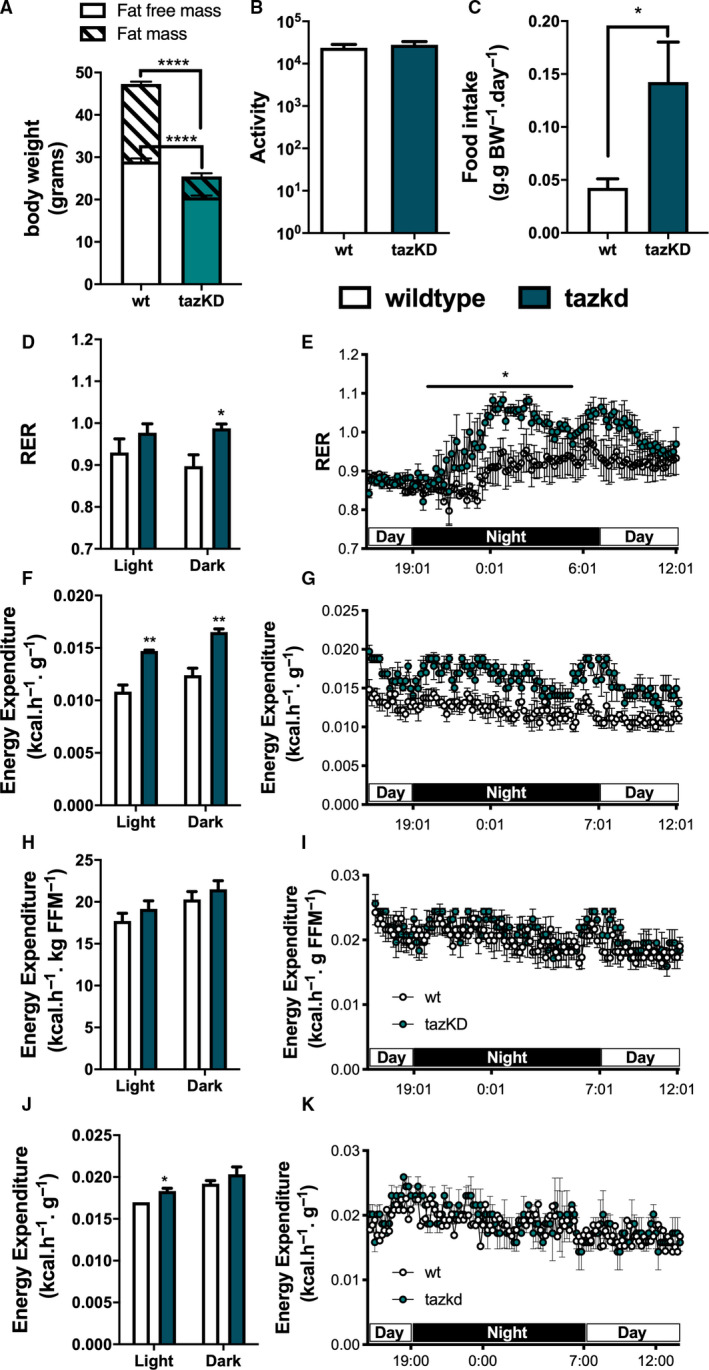
Metabolic profile of tazkd mice. (A) body weight, fat mass, and fat‐free mass of 7‐month‐old wild‐type and tazkd mice. (B) activity, measured by the number of beam breaks in the cage. (C) food intake normalized by body weight. (D and E), histogram and representative plot of RER of wild‐type and tazkd mice over a period of 24 h. (F and G) histogram and representative plot of EE (normalized by body weight) of wild‐type and tazkd mice at 6 months of age over a period of 24 h. (H and I) replot from F and G normalized by fat‐free mass. (J and K) histogram and representative plot of EE (normalized by whole body weight) of wild‐type and tazkd mice at 3 months of age over a period of 24 h. Dark and light cycles are shown. Values are mean ± SEM, n = 4. *P < 0.05;**P< 0.01, using Student's t‐test. ****P < 0.0001, 2‐way ANOVA, Sidak's post‐test.
