
Figure 2.
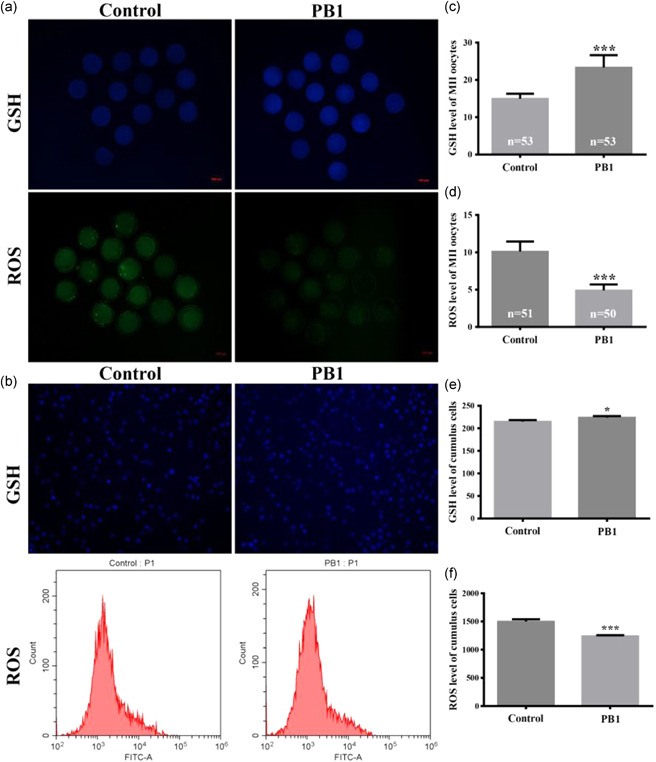
Effect of PB1 on intracellular reactive oxygen species (ROS) of MII oocytes and cumulus cells. (a) Glutathione (GSH) levels and ROS levels in MⅡ oocytes treated with 100 μM PB1 versus control. Scale bar = 100 μm. (b) GSH levels and ROS levels in cumulus cells. Scale bar = 100 μm. The value ROS levels was analyzed using histograms. (c,d) GSH levels and ROS levels, respectively, in MⅡ oocytes treated with 100 μM PB1 versus control, as measured by fluorescence intensity. Values within the bars indicate the total number of oocytes observed in each experimental group. (e,f) GSH levels and ROS levels, respectively, in cumulus cells. Values shown are mean ± standard deviation from three independent experiments. PB1, procyanidin B1. *p < 0.05, **p < 0.01, and ***p < 0.001