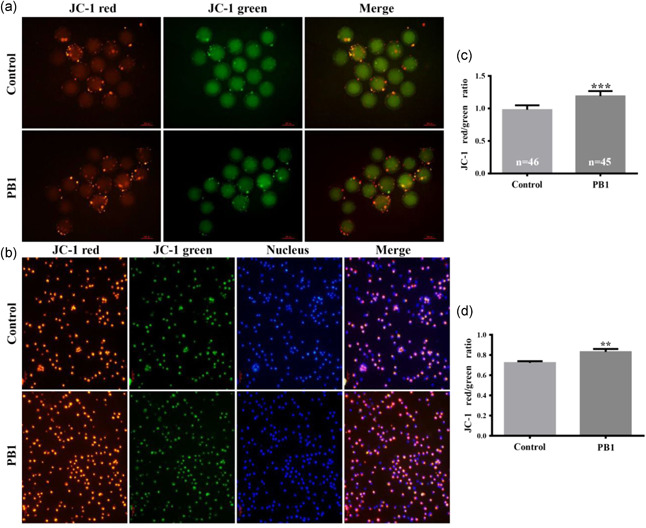
Figure 3.

Effect of PB1 on mitochondrial membrane potential (Δφm) of MII oocytes and cumulus cells. Red represents JC‐1 accumulation in the mitochondria and green represents JC‐1 excluded from mitochondria. (a,b) Fluorescence images representing the staining by JC‐1 of MⅡ oocytes and cumulus cells, respectively, in control and PB1 treated groups. Scale bar = 100 μm. (c,d) Δφm levels in MⅡ oocytes and cumulus cells, respectively. Bars represent three independent replicate experiments. The values are shown as mean ± standard deviation. PB1, procyanidin B1. *p < 0.05, **p < 0.01 and ***p < 0.001
