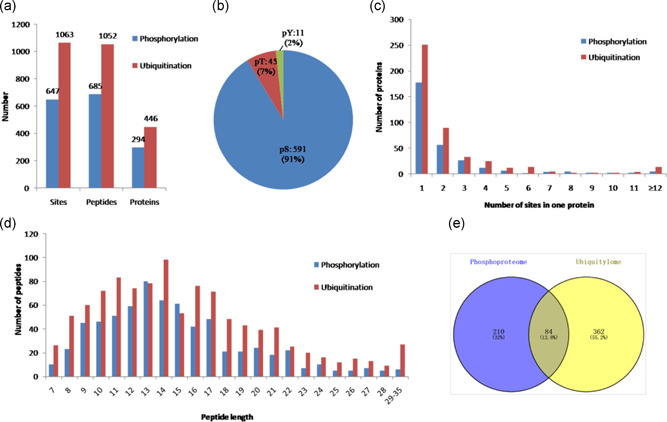
Figure 1.

Profile of identified phosphorylated and ubiquitinated sites, peptides, and proteins. (a) The total numbers of phosphorylated and ubiquitinated sites, peptides, and proteins. (b) Distribution of the phosphorylated serine, threonine, and tyrosine residues among the identified phosphorylation sites. (c) Distribution of phosphorylated and ubiquitinated sites in one protein. (d) Distribution of phosphorylated and ubiquitinated peptides based on their length. (e) The total numbers of the overlap between the phosphorylated and ubiquitinated proteins
