Figure 3.

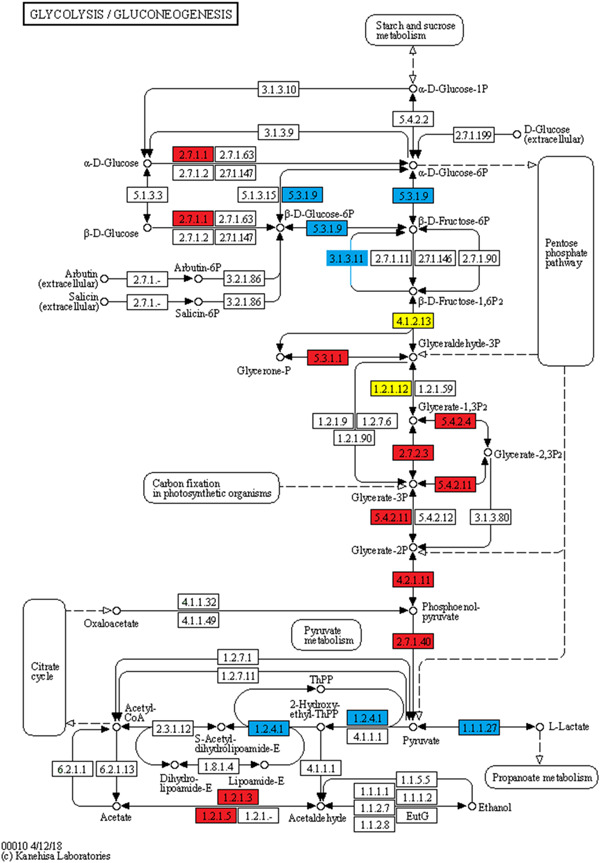
Glycolysis/gluconeogenesis pathway. Blue represents the phosphorylated proteins, red represents the ubiquitinated proteins, and yellow represent proteins both undergo phosphorylation and ubiquitination

Glycolysis/gluconeogenesis pathway. Blue represents the phosphorylated proteins, red represents the ubiquitinated proteins, and yellow represent proteins both undergo phosphorylation and ubiquitination