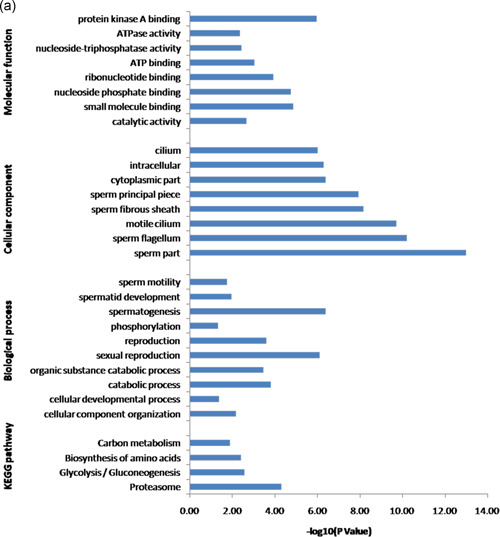
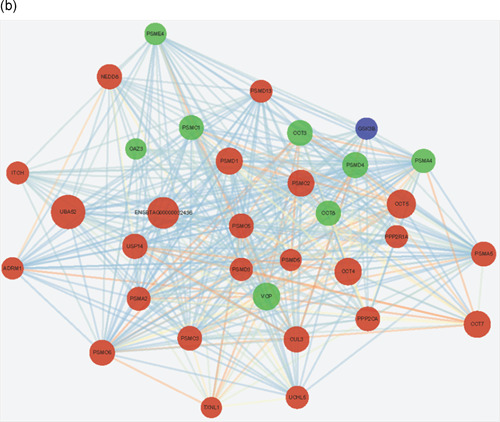
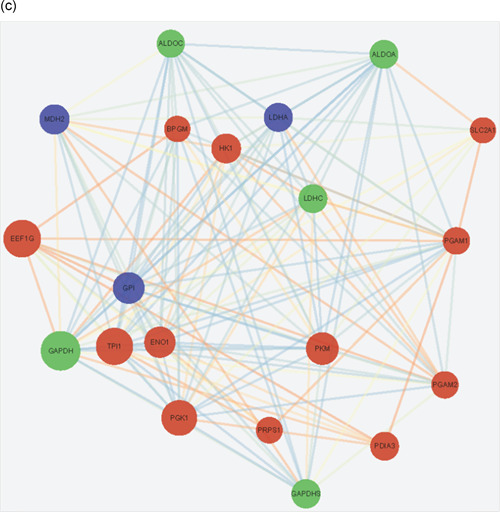
Figure 5.
Integrated analysis between phosphoproteome and ubiquitylome. (a) Gene Ontology annotation and Kyoto Encyclopedia of Genes and Genomes pathway analysis of identified 84 proteins both modified with phosphorylation and ubiquitination. Protein–protein interaction network of phosphorylated and ubiquitinated proteins clustered in (b) proteasome and (c) glycolysis/gluconeogenesis. Blue represents the phosphorylated proteins, red represents the ubiquitinated proteins, and green represents proteins both undergo phosphorylation and ubiquitination. The bubble size represents the degree of interaction


