Figure 3.

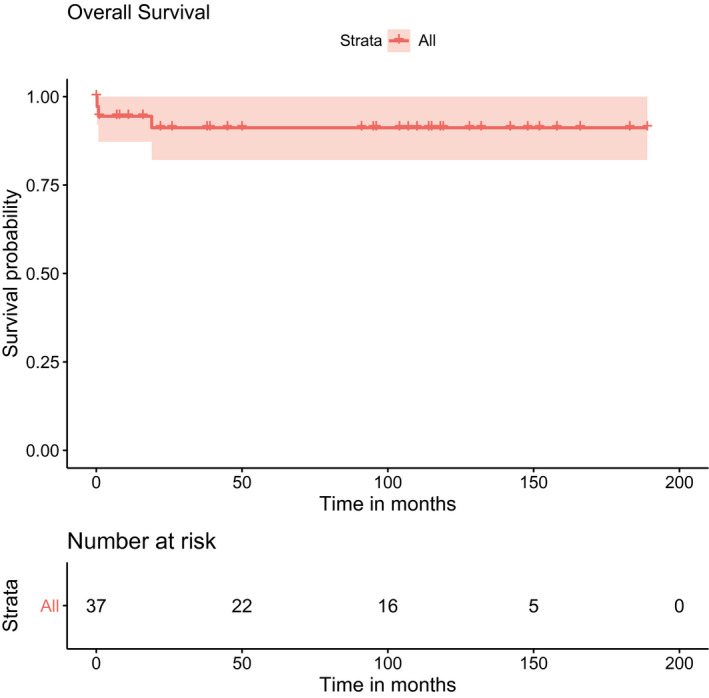
Kaplan‐Meier curve showing estimated overall survival and 95% confidence intervals for patients with WAGR syndrome and Wilms tumor (n = 37). WAGR indicates Wilms tumor, aniridia, genitourinary anomalies, and range of developmental delays.

Kaplan‐Meier curve showing estimated overall survival and 95% confidence intervals for patients with WAGR syndrome and Wilms tumor (n = 37). WAGR indicates Wilms tumor, aniridia, genitourinary anomalies, and range of developmental delays.