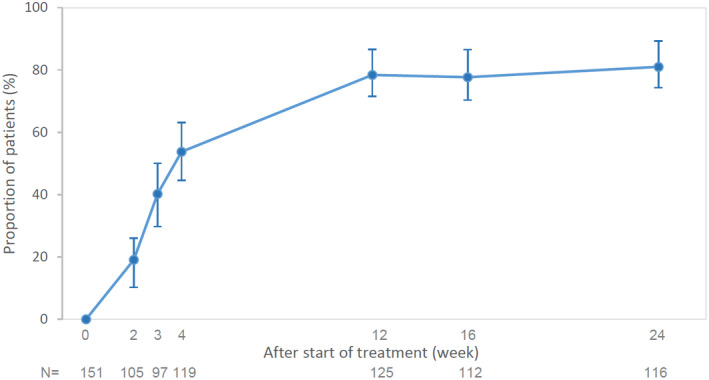
Figure 1.

Change from baseline in the proportion of patients achieving IGA 0/1 at weeks 2, 3, 4, 12, 16 and 24 are presented. Proportion of patients with IGA 0/1 and 95% CI are shown (Clopper–Pearson method was used for the calculation of 95% CI). Patients with IGA result at start of treatment and week 24 were included. CI, confidence interval; IGA, Investigator Global Assessment, N, number of patients assessed at each time point.
