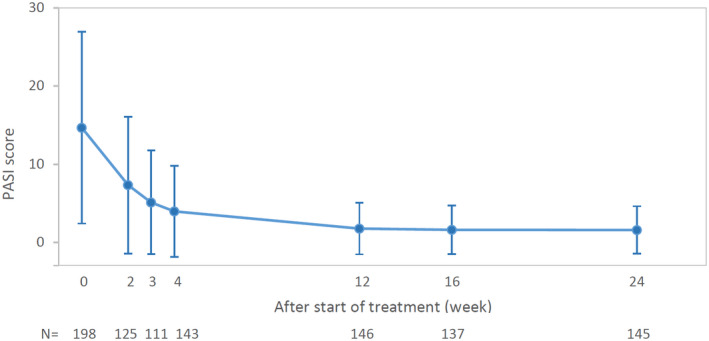
Figure 2.

Change in PASI score (mean ± SD) at baseline, and weeks 2, 3, 4, 12, 16 and 24 are presented. Patients with PASI result at start of treatment and week 24 were included. N, number of patients assessed at each time point; PASI, Psoriasis Area and Severity Index; SD, standard deviation.
