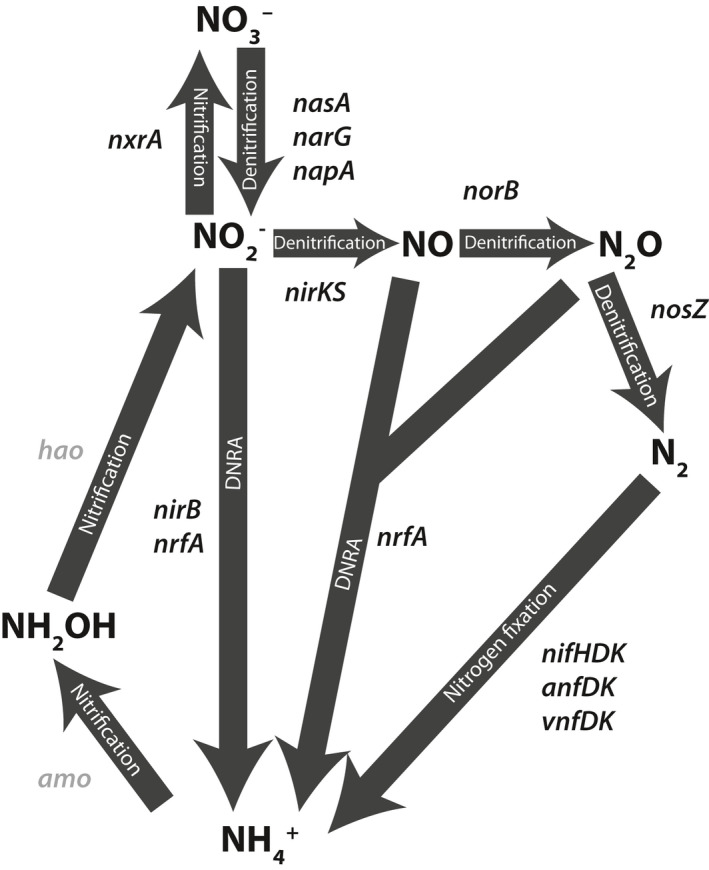
Figure 1.

Schematic of the biological nitrogen cycle. Arrows are labeled with the pathway to which they belong. All genes examined in this study are labeled next to the step they catalyze. Genes without sufficient data for subsequent analysis are labeled in gray. Adapted from Canfield et al. (2010)
