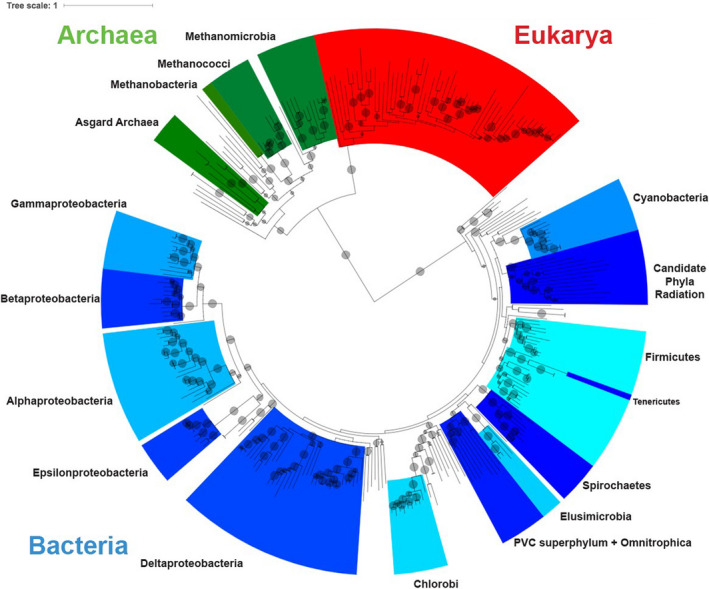
Figure 2.

Species tree used for phylogenetic analysis. Maximum likelihood phylogeny based on an alignment of concatenated single‐copy universal proteins from 308 genomes. Well‐represented bacterial and archaeal phyla are labeled in black text. Bacterial clades are labeled in alternating colors of blue, archaea in green, and eukaryotes in red. Bootstrap values (from 100 bootstraps) >50 are shown as transparent gray circles, with larger circles representing higher bootstrap values
