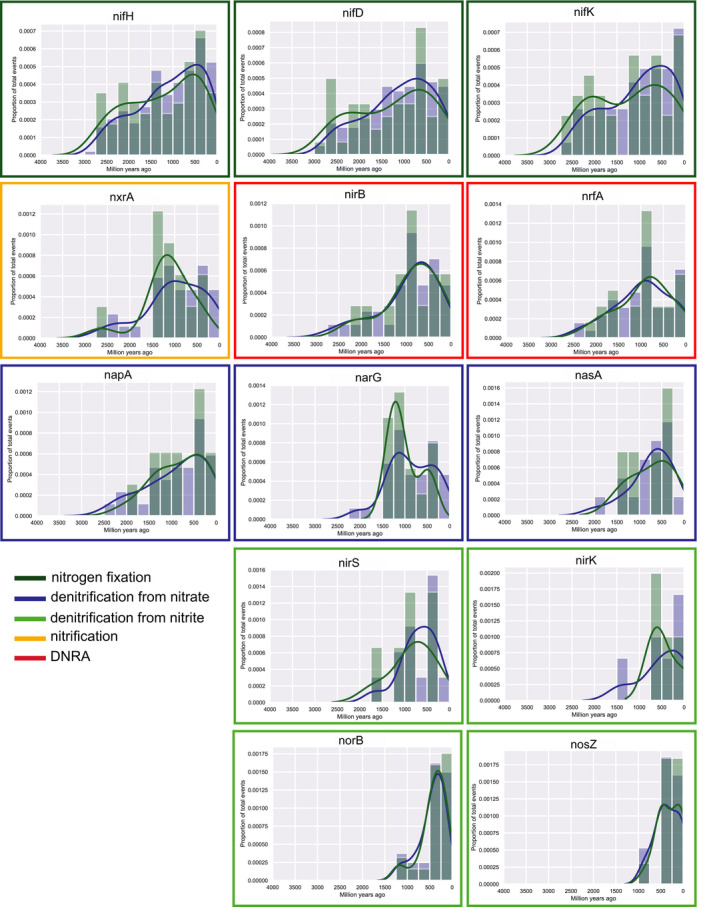
Figure 3.

Histograms and density plots of all speciation, loss, duplication, and horizontal gene transfer (HGT) events. All events are shown in blue, HGT events alone are shown in green. Events were inferred by reconciling phylogenetic trees of nitrogen‐cycling genes with a chronogram generated using a CIR clock model and conservative calibration points. Y‐axis represents proportion of all events (blue) or HGT events only (green). Borders around graphs indicate the metabolic process that the gene is involved in. Histograms are ordered according to the earliest time point at which a speciation, loss, duplication, or HGT event occurred. An equivalent figure with dates inferred from the UGAM clock model is shown in Figure S3
