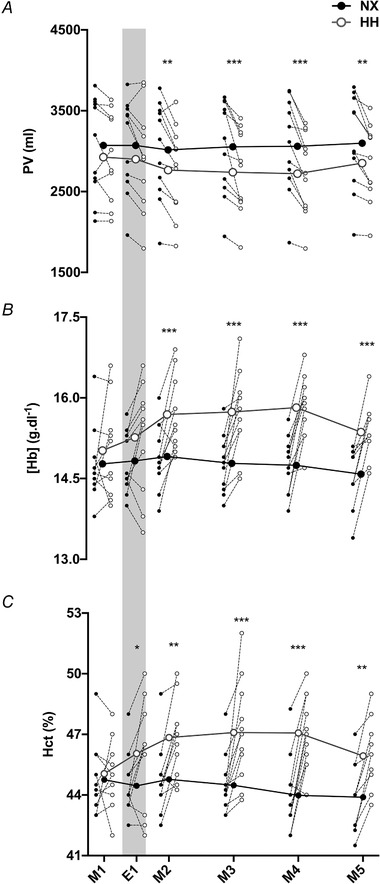
Figure 2. Effects of hypoxia on plasma volume.

Changes in plasma volume (PV) (A), venous haemoglobin concentration [Hb] (B) and haematocrit (Hct) (C) during a 4 day sojourn in normoxia (NX) and hypobaric hypoxia (HH). M1–M5, first to fifth morning of the sojourns; E1, first evening of the sojourns. Big symbols represent means, small symbols represent individual data;N = 11;* P < 0.05;** P < 0.01;*** P < 0.001 for time‐point comparisons between HH and NX by mixed model for repeated measurement (MMRM) analyses. Note that the grey shaded areas mark measurements performed in the evening whereas all other measurements were taken in the morning.
