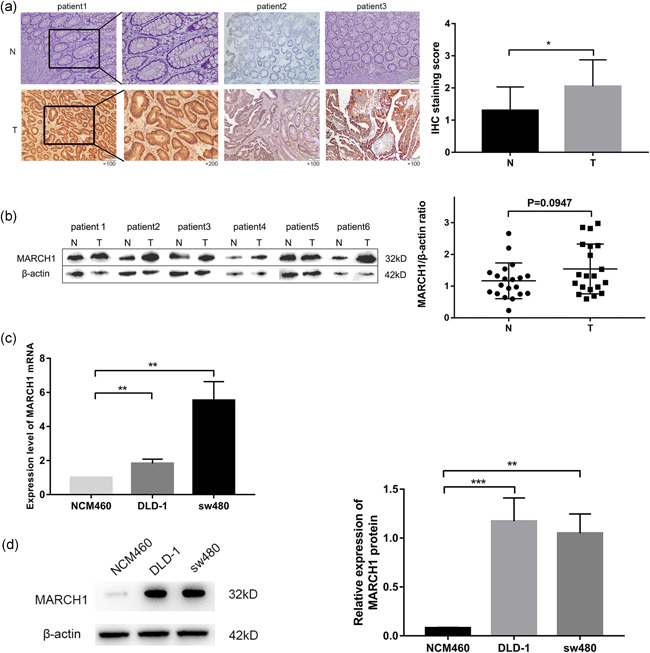
Figure 1.

Expression level of MARCH1 in CRC tissues and cell lines. (a) Immunohistochemistry (IHC) analysis of the expression level of MARCH1 in CRC tumor tissues (T) and adjacent nontumor tissues (N); IHC staining score of MARCH1 in 20 CRC patients. (b) Western blot analysis assay of the expression level of MARCH1 in CRC tumor tissues (T) and adjacent nontumor tissues (N), β‐actin was regarded as a control gene. (c, d) qRT‐PCR and western blot analysis assay detected the expression level of MARCH1 mRNA and protein in epithelial cell line and CRC cell line. Results were presented as mean ± SD of three independent experiments. **p < .01, ***p < .001. CRC, colorectal cancer; MARCH1, membrane‐associated RING‐CH‐1; mRNA, messenger RNA; qRT‐PCR, quantitative reverse‐transcription polymerase chain reaction; SD, standard deviation
